Comparative Study
. 2008 Nov;49(11):5067-76.
doi: 10.1167/iovs.07-1422. Epub 2008 Jul 24.

Functional rescue of degenerating photoreceptors in mice homozygous for a hypomorphic cGMP phosphodiesterase 6 b allele (Pde6bH620Q)

Affiliations
Comparative Study

Functional rescue of degenerating photoreceptors in mice homozygous for a hypomorphic cGMP phosphodiesterase 6 b allele (Pde6bH620Q)

Richard J Davis et al. Invest Ophthalmol Vis Sci. 2008 Nov.

Abstract

Purpose: Approximately 8% of autosomal recessive retinitis pigmentosa (RP) cases worldwide are due to defects in rod-specific phosphodiesterase PDE6, a tetramer consisting of catalytic (PDE6alpha and PDE6beta) and two regulatory (PDE6gamma) subunits. In mice homozygous for a nonsense Pde6b(rd1) allele, absence of PDE6 activity is associated with retinal disease similar to humans. Although studied for 80 years, the rapid degeneration Pde6b(rd1) phenotype has limited analyses and therapeutic modeling. Moreover, this model does not represent human RP involving PDE6B missense mutations. In the current study the mouse missense allele, Pde6b(H620Q) was characterized further.

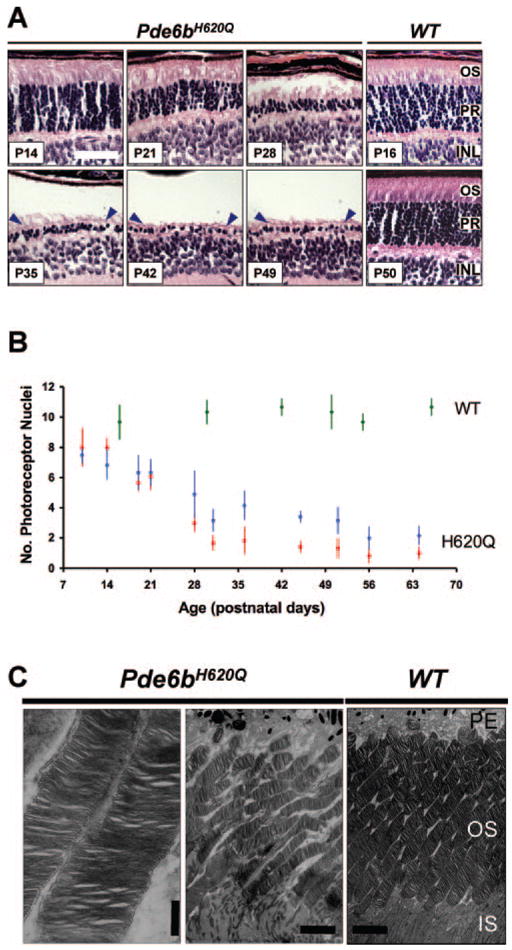
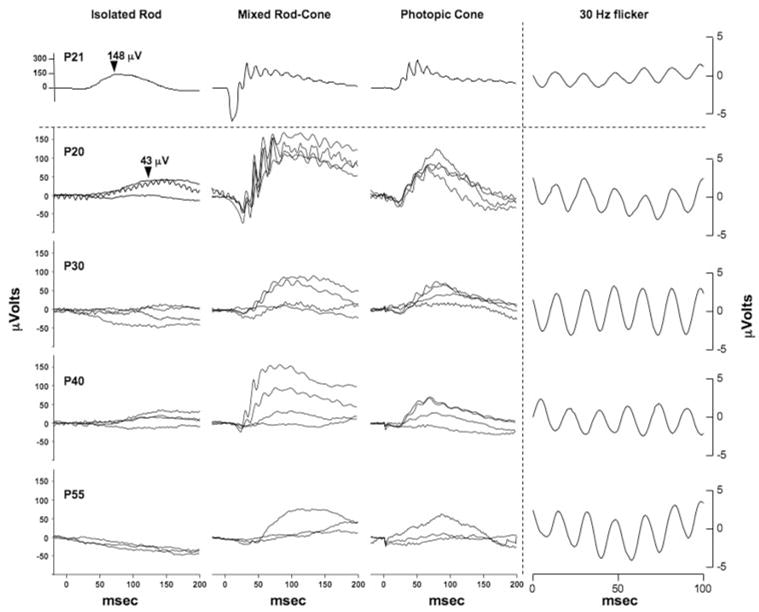
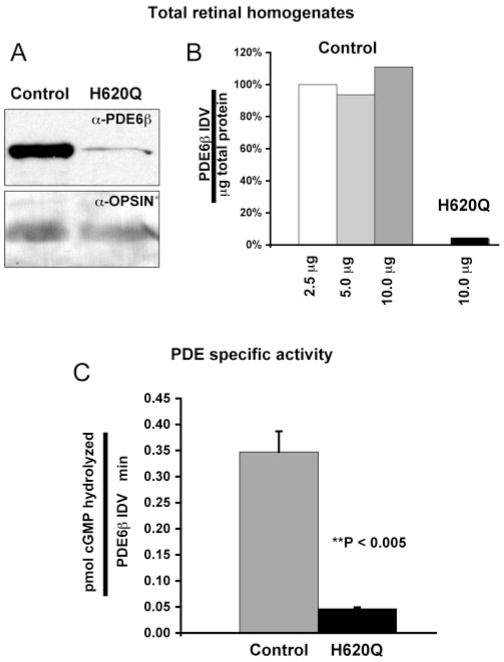
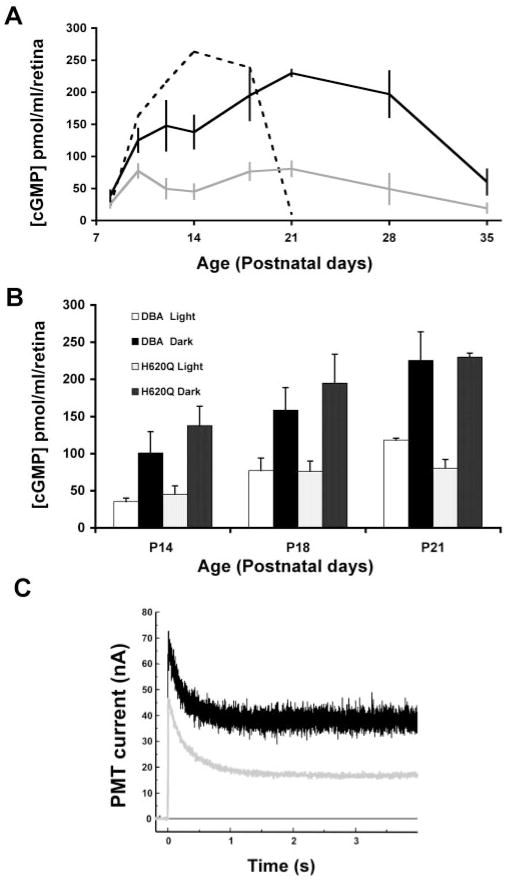
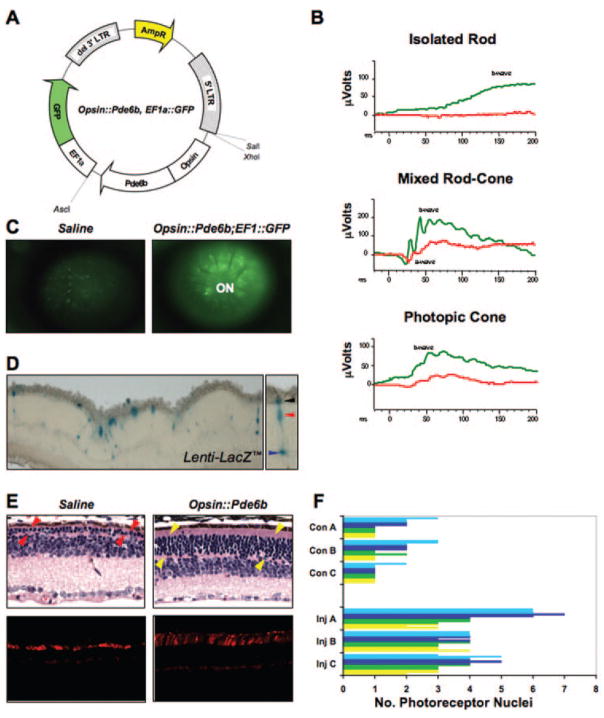
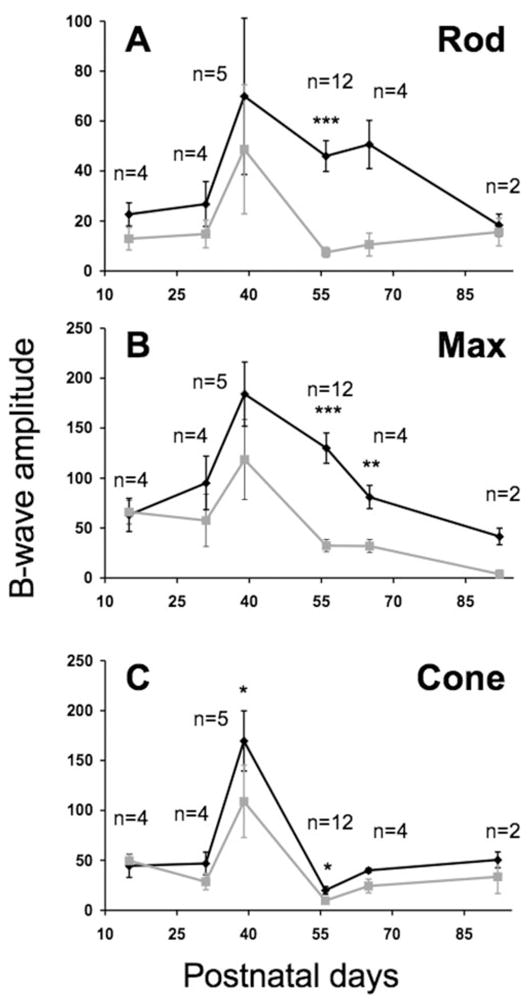
Methods: Photoreceptor degeneration in Pde6b(H620Q) homozygotes was documented by histochemistry, whereas PDE6beta expression and activity were monitored by immunoblotting and cGMP assays. To measure changes in rod physiology, electroretinograms and intracellular Ca(2+) recording were performed. To test the effectiveness of gene therapy, Opsin::Pde6b lentivirus was subretinally injected into Pde6b(H620Q) homozygotes.

Results: Within 3 weeks of birth, the Pde6b(H620Q) homozygotes displayed relatively normal photoreceptors, but by 7 weeks degeneration was largely complete. Before degeneration, PDE6beta expression and PDE6 activity were reduced. Although light-/dark-adapted total cGMP levels appeared normal, Pde6b(H620Q) homozygotes exhibited depressed rod function and elevated outer segment Ca(2+). Transduction with Opsin::Pde6b lentivirus resulted in histologic and functional rescue of photoreceptors.

Conclusions: Pde6b(H620Q) homozygous mice exhibit a hypomorphic phenotype with partial PDE6 activity that may result in an increased Ca(2+) to promote photoreceptor death. As degeneration in Pde6b(H620Q) mutants is slower than in Pde6b(rd1) mice and can be suppressed by Pde6b transduction, this Pde6b(H620Q) model may provide an alternate means to explore new treatments of RP.


Figures

Figure 1
Figure 1
Pde6bH620Q homozygotes demonstrated delayed and progressive photoreceptor degeneration. (A) H&E-stained paraffin-embedded sections of Pde6bH620Q mutant (P14 –P49) and wild-type control (P16 and P50) mice. Shown are the outer segments (OS) photorecep-tors (PR) and inner nuclear layer (INL). Blue arrowheads: mutant photoreceptor layer after P35. (B) Rates of photoreceptor degeneration in Pde6bH620Q mutants. Average number of photoreceptor nuclei in mutants, counted near the optic nerve (red) and periphery (blue), and wild-type retinas (green). (C) Electron photomicrographs of Pde6bH620Q mutant (P21, left and middle) and wild-type control (right) OS discs. Portions of the retinal pigmented epithelium (PE) and inner segment (IS) are shown. Scale bar: (A) 50 mm; (C) left: 500 nm; middle, right: 55 nm.
Figure 2
Figure 2
Progressive reduction of ERG responses in Pde6bH620Q homozygotes. Rod-specific (left), mixed rod-cone (middle), and transient photopic cone (right) responses in wild-type (above dotted line) and Pde6bH620 mutant (below dotted line) mice. Ages of mice are indicated in the left column. Traces from three to four mice are shown for each time-point. Arrowheads: the rod b-wave peaks for 3-week-old wild-type and mutant mice. Far right: average bright light stimulation (30 Hz) responses of wild-type and mutant mice are shown.
Figure 3
Figure 3
Reduced PDE6β expression and PDE6 activity in Pde6bH620Q homozygous retinas. (A) Immunoblot detection of PDE6β and opsin in P16 to P18 mutant and wild-type in total retinal homogenates. (B) Quantitative analysis of PDE6β signals from total retinal homogenates. Signal intensities were determined by densitometry to calculate an IDV for each band. The values were normalized for the amount of protein loaded and expressed as a percentage relative to PDE6β signal in 2.5 mg of control lysate. Similar normalized values are obtained at different loading amounts. (C) Light-adapted PDE6 activity in P20 control and mutant retinal extracts. PDE activity from control and mutant hypotonic extracts were normalized to PDE6β content (IDV).
Figure 4
Figure 4
Light stimulated changes in cGMP and Ca2+ levels in Pde6bH620Q homozygotes. (A) Total cGMP levels measured in (gray line) light- and (black line) dark-adapted Pde6bH620Q mice (1–7 weeks of age). Dashed line: changes in cGMP levels in light-adapted Pde6brd1 null mutants (C3H strain). (B) Comparison of light- and dark-adapted cGMP levels between Pde6bH620Q mutants and DBA/2J control mice at P14, P18, and P21 (see also Refs. 43,44). White columns: light-adapted control mice; black columns: dark-adapted control; light stippled columns: light-adapted mutant mice; dark stippled columns: dark-adapted mutants. Averages and standard deviations are based on measurements from at least four mice per time point. (C) Intracellular Ca2+ measurements in Pde6bH620Q mutant (black trace) and control (gray trace) rod OS by spot confocal recording. Fluorescence from rods loaded with Ca2+ indicator fluo5F are detected as photomultiplier tube current (PMT). Decreases in fluorescence reflect changes in intracellular Ca2+ after membrane channel closure (laser illumination at time 0). Mean dark and light intracellular [Ca2+] levels are then calculated.
Figure 5
Figure 5
Transduction of Pde6bH620Q homozygous photoreceptors with Opsin::Pde6b lentiviral particles. (A) The Opsin::Pde6b, EF1a::Green Fluorescent Protein (GFP) vector used for generation of lentiviral particles. (B) ERG responses of mutants subretinally injected with Opsin:Pde6b; EF1::GFP virus (right eye, green trace) and saline (left eye, red trace). Injections were performed at P5, whereas ERGs were measured at P38. b-Wave: inner retinal responses; a-wave: photoreceptor responses. (C) Live retinal fluorescence imaging of Pde6bH620Q eyes injected with saline (left) or Opsin:Pde6b; EF1::GFP (right). Images were obtained at 8 weeks, 54 days after injection. (D) Left: β-galactosidase activity detected in photoreceptors from Lenti-LacZ -transduced Pde6bH620Q retinas at 2 weeks, 9 days after injection. Right: black, red, and blue arrowheads indicate photoreceptor OS/IS, cell body, and synapse, respectively. (E) Histologic analysis of Opsin::Pde6b-transduced retinas. H&E stained (top, P33) and peanut agglutinin-stained (bottom, P77) retinal sections from (left) saline- and (right) Opsin::Pde6b-injected Pde6bH620Q eyes. Images were obtained from similar retinal locations: superior to the optic nerve head, toward the posterior side of the retina. Arrowheads: photo-receptor nuclear layer. (F) Quantitative analysis of photoreceptors in Pde6bH620Q homozygous eyes injected with saline (Con A, B, C) or Opsin:Pde6b; EF1::GFP (Inj A, B, C). The number of photoreceptor nuclei were counted from retinas divided equally into four quadrants from optic nerve to the periphery (yellow, green, dark blue, light blue bars). Within each quadrant, three different locations were randomly selected for nucleus counting.
Figure 6
Figure 6
Functional rescue of phototransduction in Opsin::Pde6b transduced Pde6bH620Q homozygous retinas. Subretinal injections of Opsin::Pde6b into the right eye (black line) or control injections of CMV::GFP lentivirus or saline into the left eye (gray line) of P5 mutant mice. ERGs were performed on both eyes simultaneously, between P15 and P92. Shown are the mean and SEM of b-wave amplitudes (Vmax) for (A) dark-adapted rod isolated, (B) maximum mixed rod-cone, and (C) light-adapted cone responses. Student’s t-test was performed to determine probabilities for paired differences in b-wave peaks between injected and controls (see also Table 1). Significance: *P < 0.05; **P < 0.01; ***P < 0.001. The number of mice analyzed per time point (n) is indicated.

References

    1. Hebert LE, Scherr PA, Bienias JL, Bennett DA, Evans DA. Alzheimer disease in the US population: prevalence estimates using the 2000 census. Arch Neurol. 2003;60:1119 –1122. - PubMed
    1. Klein R, Klein BE, Jensen SC, Mares-Perlman JA, Cruickshanks KJ, Palta M. Age-related maculopathy in a multiracial United States population: the National Health and Nutrition Examination Survey III. Ophthalmology. 1999;106:1056 –1065. - PubMed
    1. Klein R, Rowland ML, Harris MI. Racial/ethnic differences in age-related maculopathy. Third National Health and Nutrition Examination Survey. Ophthalmology. 1995;102:371–381. - PubMed
    1. Hahn LB, Berson EL, Dryja TP. Evaluation of the gene encoding the gamma subunit of rod phosphodiesterase in retinitis pigmentosa. Invest Ophthalmol Vis Sci. 1994;35:1077–1082. - PubMed
    1. Huang SH, Pittler SJ, Huang X, Oliveira L, Berson EL, Dryja TP. Autosomal recessive retinitis pigmentosa caused by mutations in the alpha subunit of rod cGMP phosphodiesterase. Nat Genet. 1995;11:468 – 471. - PubMed

Publication types

MeSH terms