Comparative Study
. 2008 Nov;49(11):5103-10.
doi: 10.1167/iovs.08-2127. Epub 2008 Jul 24.

Ultrahigh-speed optical coherence tomography for three-dimensional and en face imaging of the retina and optic nerve head

Affiliations
Comparative Study

Ultrahigh-speed optical coherence tomography for three-dimensional and en face imaging of the retina and optic nerve head

Vivek J Srinivasan et al. Invest Ophthalmol Vis Sci. 2008 Nov.

Abstract

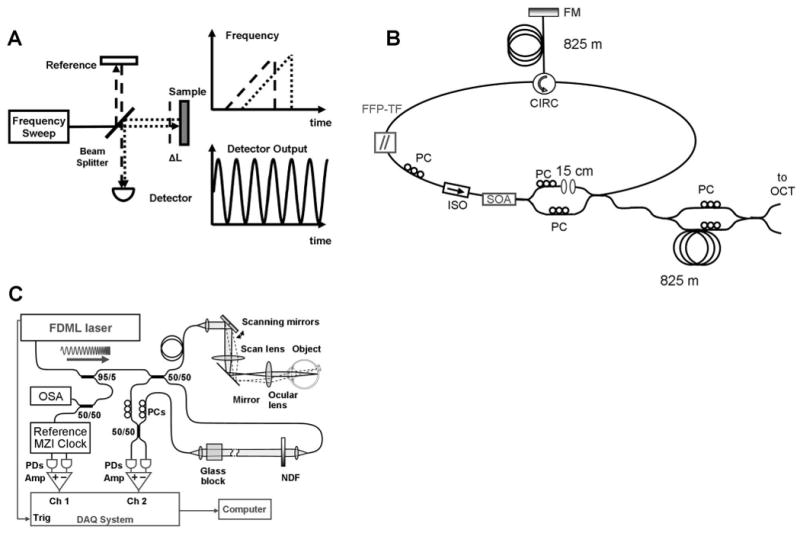
Purpose: To demonstrate ultrahigh-speed optical coherence tomography (OCT) imaging of the retina and optic nerve head at 249,000 axial scans per second and a wavelength of 1060 nm. To investigate methods for visualization of the retina, choroid, and optic nerve using high-density sampling enabled by improved imaging speed.

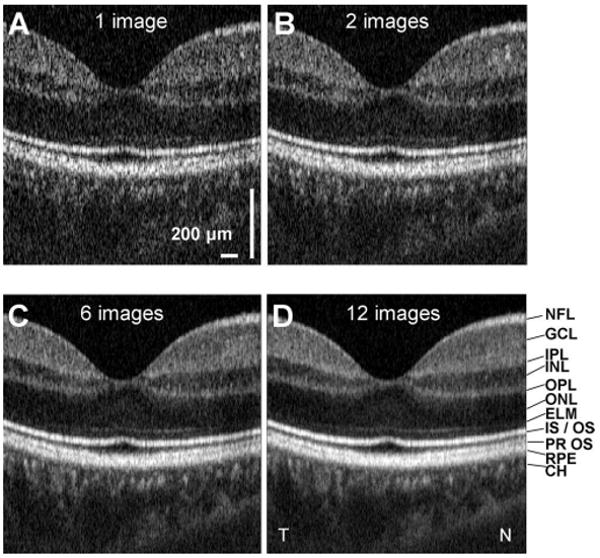
Methods: A swept-source OCT retinal imaging system operating at a speed of 249,000 axial scans per second was developed. Imaging of the retina, choroid, and optic nerve were performed. Display methods such as speckle reduction, slicing along arbitrary planes, en face visualization of reflectance from specific retinal layers, and image compounding were investigated.

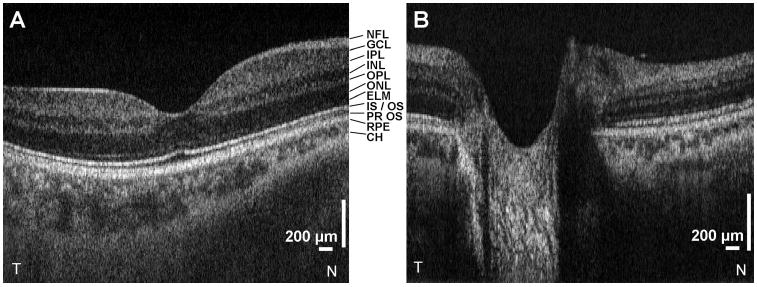
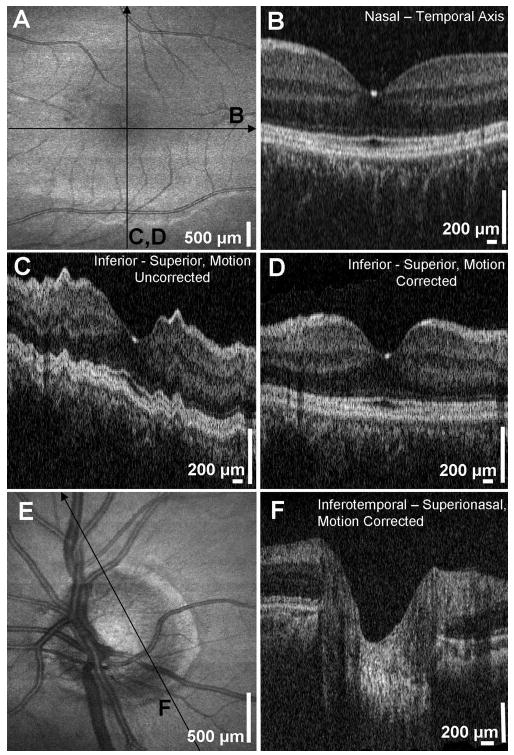
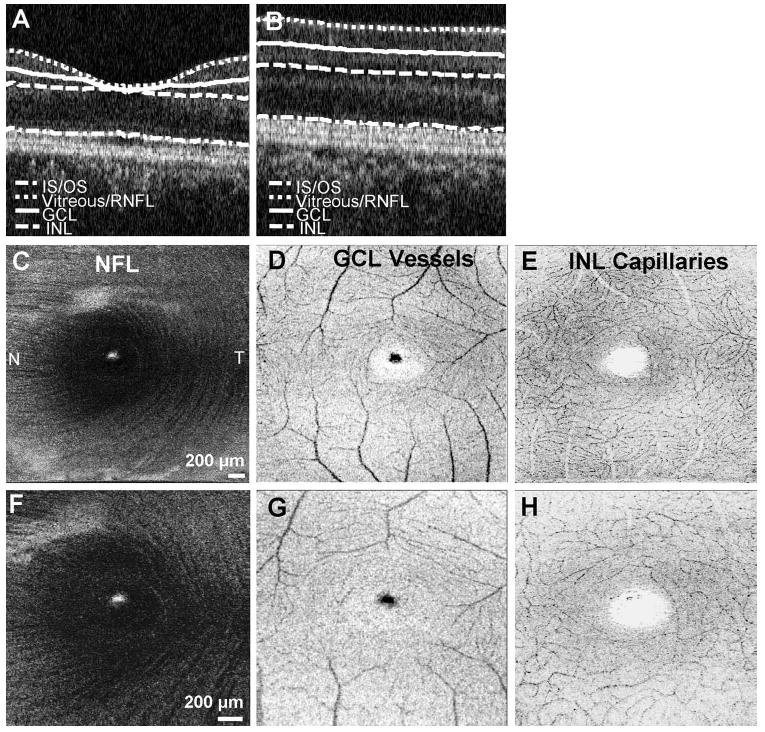
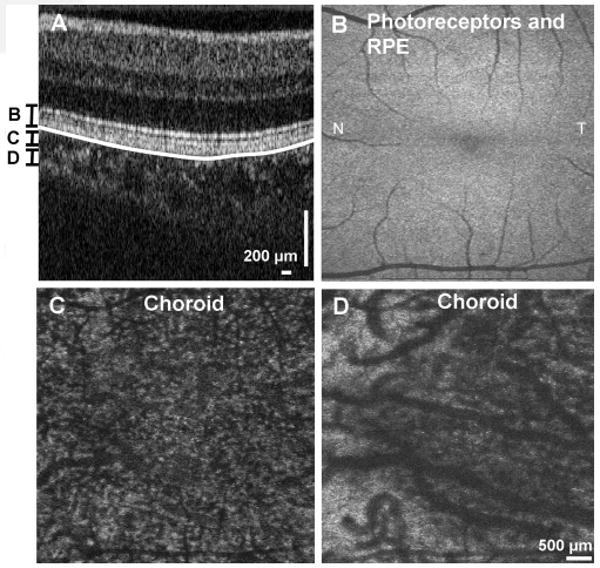
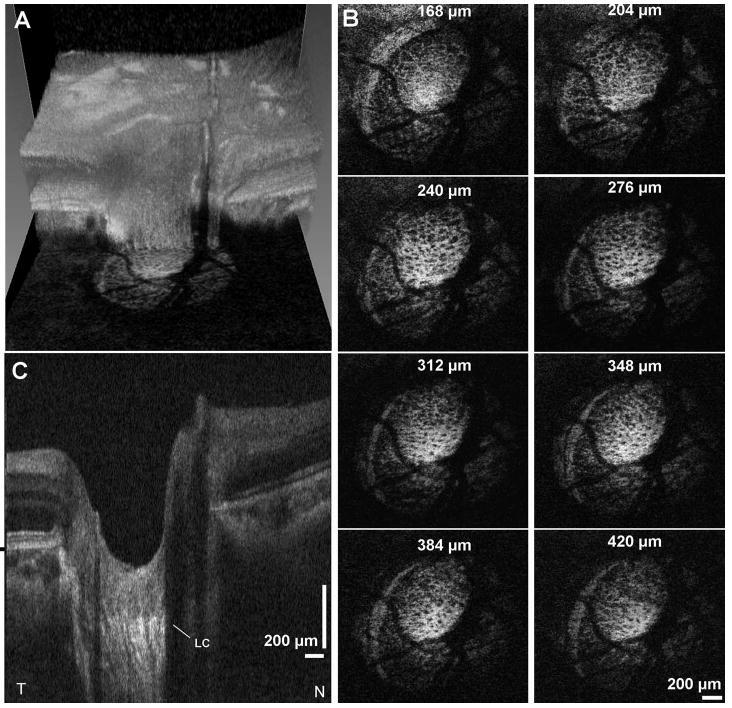
Results: High-definition and three-dimensional (3D) imaging of the normal retina and optic nerve head were performed. Increased light penetration at 1060 nm enabled improved visualization of the choroid, lamina cribrosa, and sclera. OCT fundus images and 3D visualizations were generated with higher pixel density and less motion artifacts than standard spectral/Fourier domain OCT. En face images enabled visualization of the porous structure of the lamina cribrosa, nerve fiber layer, choroid, photoreceptors, RPE, and capillaries of the inner retina.

Conclusions: Ultrahigh-speed OCT imaging of the retina and optic nerve head at 249,000 axial scans per second is possible. The improvement of approximately 5 to 10x in imaging speed over commercial spectral/Fourier domain OCT technology enables higher density raster scan protocols and improved performance of en face visualization methods. The combination of the longer wavelength and ultrahigh imaging speed enables excellent visualization of the choroid, sclera, and lamina cribrosa.


Conflict of interest statement

Disclosure: V.J. Srinivasan, None; D.C. Adler, None; Y. Chen, None; I. Gorczynska, None; R. Huber, LightLab Imaging (P); J.S. Duker, None; J.S. Schuman, Carl Zeiss Meditec (P), LightLab Imaging (P); J.G. Fujimoto, Carl Zeiss Meditec (P), LightLab Imaging (P), Optovue (C, I)

Figures

Figure 1
Figure 1
(A) Principles of swept-source OCT detection. (B) Diagram of a FDML laser used as the frequency swept light source. (C) Schematic of interferometer and OCT data acquisition used for retinal imaging. PC, polarization controller; ISO, isolator; CIRC, circulator; FM, Faraday mirror; FFP-TF, fiber Fabry-Perot tunable filter; SOA, semiconductor optical amplifier; PD, photodiode; OSA, optical spectrum analyzer; MZI, Mach-Zehnder interferometer; DAQ, data acquisition; NDF, neutral density filter.
Figure 2
Figure 2
High-definition imaging of (A) the retina and (B) the optic nerve head. Beam diameter at cornea, 1.4 mm. Axial scans per image, 16,000. NFL, nerve fiber layer; GCL, ganglion cell layer; IPL, inner plexiform layer; INL, inner nuclear layer; OPL, outer plexiform layer; ONL, outer nuclear layer; ELM, external limiting membrane; IS/OS, photoreceptor inner segment/outer segment junction; PR OS, photoreceptor outer segments; RPE, retinal pigment epithelium; CH, choroid.
Figure 3
Figure 3
(A) OCT fundus image of the retina, without motion correction. (B) Slice through 3D OCT data set along the fast axis. (C) Slice through 3D OCT data set along the slow axis, showing the severity of axial motion. (D) Slice through 3D OCT data set along the slow axis, after correcting for axial motion. (E) OCT fundus image of the optic nerve head, without motion correction. (F) Oblique slice through 3D OCT data set, after correcting for axial motion. Beam diameter at cornea, 1.4 mm (AD) and 2.9 mm (EF). 512 × 850 axial scans.
Figure 4
Figure 4
En face visualization of retinal layers. Processing a 3D OCT data set makes enhanced visualization of individual intraretinal layers possible. (A, B) Different layers or boundaries are delineated and used to enhance visualization of anatomy. Imaging was performed over a 3 × 3-mm (C–E) and a 2 × 2-mm (F–H) field of view. En face visualizations of the (C, F) nerve fiber layer (NFL), (D, G) blood vessels in the ganglion cell layer (GCL), and (E, H) capillary network of the inner nuclear layer (INL) is shown. Inner retinal vasculature images (D, E, G, H) are displayed with an inverted grayscale. Beam diameter at cornea, 2.9 mm. 512 × 850 axial scans.
Figure 5
Figure 5
En face visualization of the outer retina and choroid in the macular region by axial integration of 3D OCT data. (A) Cross-sectional image showing the contour of Bruch's membrane (white line), and the axial integration ranges for (B–D). Shown are en face images of (B) the photoreceptors and RPE; (C) the choroid showing predominantly smaller vessels; (D) of the choroid showing predominantly larger vessels. Beam diameter at cornea: 1.4 mm. 512 × 850 axial scans.
Figure 6
Figure 6
(A–D) Median filtering of OCT images improves visualization of the details of retinal layers. Although a dramatic improvement in visualization of intraretinal detail is seen by compounding two images (B) versus no compounding (A), little improvement is obtained by compounding 12 images (D) versus compounding 6 images (C). Beam diameter at cornea: 1.4 mm. 512 × 850 axial scans.
Figure 7
Figure 7
Imaging of the lamina cribrosa. (A) Images are interpolated onto en face planes through the 3D OCT data set at different depths relative to the RPE. (B) Interpolated images show the porous structure of the lamina cribrosa. Depths relative to Bruch's membrane are shown. (C) A series of six consecutive images compounded by median filtering along the slow axis shows enhanced visualization of deeper structures. The lamina cribrosa (LC) is clearly visible. Beam diameter at cornea: 1.4 mm. 512 × 450 axial scans.

References

    1. Huang D, Swanson EA, Lin CP, et al. Optical coherence tomography. Science. 1991;254(5035):1178–1181. - PMC - PubMed
    1. Puliafito CA, Hee MR, Lin CP, et al. Imaging of macular diseases with optical coherence tomography. Ophthalmology. 1995;102(2):217–229. - PubMed
    1. Schuman JS, Puliafito CA, Fujimoto JG. Optical Coherence Tomography of Ocular Diseases. 2nd. Thorofare, NJ: Slack Inc.; 2004.
    1. Fercher AF, Hitzenberger CK, Kamp G, Elzaiat SY. Measurement of intraocular distances by backscattering spectral interferometry. Opt Commun. 1995;117(1–2):43–48.
    1. Häusler G, Lindner MW. “Coherence radar” and “spectral radar”: new tools for dermatological diagnosis. J Biomed Opt. 1998;3(1):21–31. - PubMed

Publication types

MeSH terms