. 2008 Sep 19;283(38):25944-51.
doi: 10.1074/jbc.M803756200. Epub 2008 Jul 25.

SNAP-25 substrate peptide (residues 180-183) binds to but bypasses cleavage by catalytically active Clostridium botulinum neurotoxin E

Affiliations

SNAP-25 substrate peptide (residues 180-183) binds to but bypasses cleavage by catalytically active Clostridium botulinum neurotoxin E

Rakhi Agarwal et al. J Biol Chem. .

Abstract

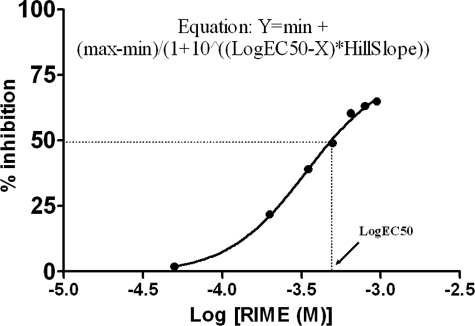
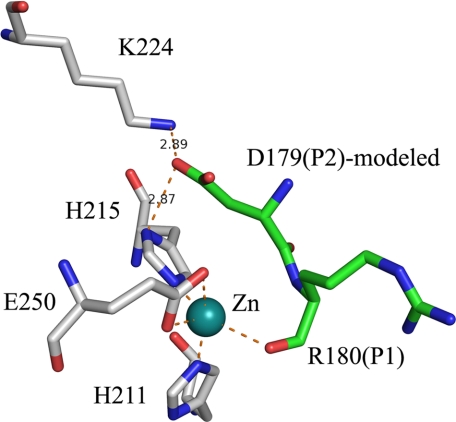
Clostridium botulinum neurotoxins are the most potent toxins to humans. The recognition and cleavage of SNAREs are prime evente in exhibiting their toxicity. We report here the crystal structure of the catalytically active full-length botulinum serotype E catalytic domain (BoNT E) in complex with SNAP-25 (a SNARE protein) substrate peptide Arg(180)-Ile(181)-Met(182)-Glu(183) (P1-P3'). It is remarkable that the peptide spanning the scissile bond binds to but bypasses cleavage by the enzyme and inhibits the catalysis fairly with K(i) approximately 69 microm. The inhibitory peptide occupies the active site of BoNT E and shows well defined electron density. The catalytic zinc and the conserved key residue Tyr(350) of the enzyme facilitate the docking of Arg(180) (P1) by interacting with its carbonyl oxygen that displaces the nucleophilic water. The general base Glu(212) side chain interacts with the main chain amino group of P1 and P1'. Conserved Arg(347) of BoNT E stabilizes the proper docking of the Ile(181) (P1') main chain, whereas the hydrophobic pockets stabilize the side chains of Ile(181) (P1') and Met(182) (P2'), and the 250 loop stabilizes Glu(183) (P3'). Structural and functional analysis revealed an important role for the P1' residue and S1' pocket in driving substrate recognition and docking at the active site. This study is the first of its kind and rationalizes the substrate cleavage strategy of BoNT E. Also, our complex structure opens up an excellent opportunity of structure-based drug design for this fast acting and extremely toxic high priority BoNT E.


Figures

FIGURE 1.
FIGURE 1.
BoNT E enzyme inhibition assay with SNAP-25-RIME (P1–P3′) using the 146–186-amino acid-long peptide substrate. The tetrapeptide showed an IC50 value of 340 μm (GraphPad software; logEC50 = IC50) and Ki of 69 μm using the Cheng-Prusoff equation, Ki = IC50/1 + ([S]/km). [S] and km are the substrate concentration and Michaelis-Menten constant, respectively.
FIGURE 2.
FIGURE 2.
The SNAP-25 P1:Arg180-P1′:Ile181-P2′:Met182-P3′:Glu183-amide (RIME) binding and interactions at and near the active site of BoNT E. A, schematic diagram of the BoNT-E-RIME complex structure. The native substrate-free and complex structures vary with the addition of the 250 loop (cyan diagram). BoNT E is shown in a blue and yellow diagram, RIME in a magenta ball and stick model, and zinc in a green sphere model. Only molecule B is shown for clarity. B, BoNT E is shown in a blue surface model and RIME in a white ball and stick model to show that the substrate peptide binds in a cavity at and near the active site. C, the dashed line in orange shows the interactions of P1–P3′ residues of RIME with various residues of the S1–S3′ pocket of BoNT E. The RIME and enzyme residues are shown in green and white ball and stick models, respectively. BoNT E secondary structure is shown in a blue loop diagram. The RIME (P1–P3′) and BoNT E residues are labeled in green and black, respectively. Figs. 2, 3, 5, and 6 are made using the PYMOL program (38).
FIGURE 3.
FIGURE 3.
The walleye stereo view of the substrate electron density omit map contoured at the 1σ level at RIME peptide (green ball and stick model, unlabeled for clarity). BoNT E residues interacting with RIME are shown in a white ball and stick model and labeled in black.
FIGURE 4.
FIGURE 4.
The schematic representation of interactions and distances of the RIME peptide representing the P1-P1′-P2′-P3′ residues of SNAP-25 with BoNT E residues identifying the S1-S1′-S2′-S3′ pocket. The RIME peptide and BoNT E substrate subsite residues are in a blue and gray stick model. The distances (Å) are given in green numbers. The red double arrowhead points to the scissile bond of cleavage. The figure is made using the Chemdraw program (CambridgeSoft).
FIGURE 5.
FIGURE 5.
Modeling of P2:Asp179 and identification of the S2 pocket residues. This modeling is based on P2:Asn196 of SNAP-25 as in a complex structure of SNAP-25-BoNT A (Protein Data Bank code 1XTG) with few adjustments. RIME and BoNT E are shown in green and white ball and stick models.
FIGURE 6.
FIGURE 6.
The superposition of BoNT E-substrate peptide RIME (P1–P3′) with the BoNT A inhibitor peptides, N-Ac-CRATKML (Protein Data Bank code 3BOO) and RRGC (Protein Data Bank code 3C88). Here the P1, P1′, P2′, and P3′ positions in the RIME structure are Arg-Ile-Met-Glu; in RRGC they are Arg-Arg-Gly-Cys; and in N-Ac-CRATKML they are oxidized Cys-acetate-Arg-Ala. BoNT E, RIME, BoNT A-RRGC, and BoNT A-N-Ac-CRATKML structures are shown in white, green, magenta, and cyan ball and stick models, respectively. Zinc is in a deep cyan color for RIME (zinc of other structures is not shown for clarity). A, the position of oxidized cysteine (CSO), acetate (ACE), Arg, and Ala in the N-Ac-CRATKML structure aligns well with the P1:Arg-, P1′:Ile-, P2:Met-, and P3′:Glu- of the BoNT E-RIME structure but for BoNT A in actual RATKML represents P1′–P6′. B, the P1-P1′-P2′ of RRGC aligns with RIME with few differences. Cys of RRGC goes in a very different spatial position, which is different from the equivalent P3′:Glu for BoNT E and Ala in N-Ac-CRATKML. C, superposition of P1 residues and S1 pockets in all three structures. Only BoNT E residues are labeled. D, superposition of P1′ residues and S1′ pockets in all three structures. Black and magenta labels represent BoNT E and A, respectively.
FIGURE 7.
FIGURE 7.
A mechanism of catalysis and transition state interactions adopted by BoNT E. The precise substrate docking at the active site (stage A) leads to a transition state (stage B), which facilitates cleavage of the scissile bond. The figure is made using Chemdraw program (CambridgeSoft).

References

    1. DasGupta, B. R., and Rasmussen, S. (1983) Toxicon 21 566–569 - PubMed
    1. Dasgupta, B. R., and Rasmussen, S. (1983) Toxicon 21 535–545 - PubMed
    1. Sathyamoorthy, V., and DasGupta, B. R. (1985) Biochem. Biophys. Res. Commun. 127 768–772 - PubMed
    1. Sathyamurthy, V., and Dasgupta, B. R. (1985) J. Biol. Chem. 260 10461–10466 - PubMed
    1. Montecucco, C., and Schiavo, G. (1994) Mol. Microbiol. 13 1–9 - PubMed

Publication types

Associated data