. 2008 Nov 1;95(9):4456-68.
doi: 10.1529/biophysj.108.133165. Epub 2008 Jul 25.

External Ba2+ block of human Kv1.5 at neutral and acidic pH: evidence for Ho+-induced constriction of the outer pore mouth at rest

Affiliations

External Ba2+ block of human Kv1.5 at neutral and acidic pH: evidence for Ho+-induced constriction of the outer pore mouth at rest

Y May Cheng et al. Biophys J. .

Abstract

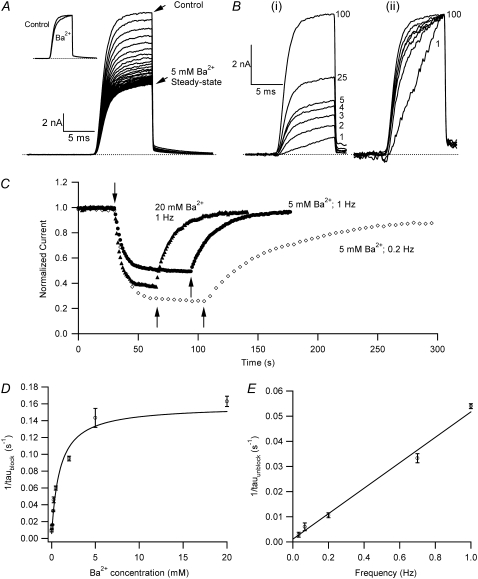
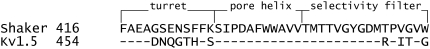
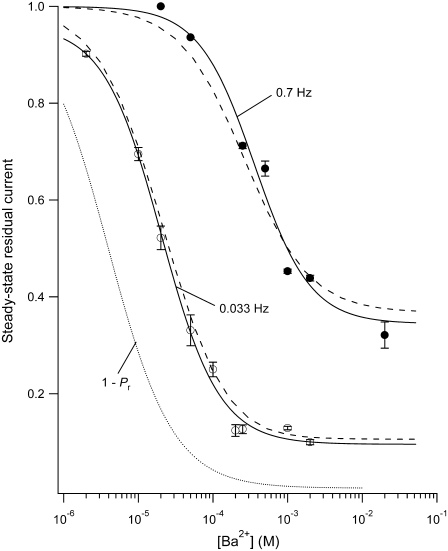
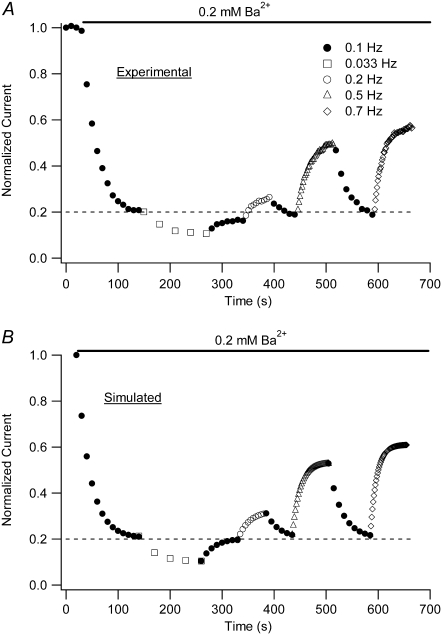
Previous studies have shown that low pHo accelerates depolarization-induced inactivation and decreases the macroscopic conductance by reducing channel availability. To test the hypothesis that outer pore constriction underlies the decreased conductance at low pHo, external Ba2+ was used to examine the accessibility of the channel pore at rest under neutral and acidic conditions. At pHo 7.4, Ba2+ block of closed channels follows a monoexponential time course and involves a low-affinity superficial site (KD congruent with 1 mM, -80 mV, 0 mM Ko(+)) and a high-affinity site (KD congruent with 4 microM) deeper in the pore. Depolarization promotes Ba2+ dissociation and an analytical model incorporating state-dependent changes of Ba2+ affinity is presented that replicates the frequency dependence of the time course and the extent of block. Open-channel block by Ba2+ is weak. At pHo 5.5, both the access to and exit from the deep site is inhibited. These results are consistent with a low-pHo-induced conformational change in the outer pore that prevents Ba2+ binding at rest or unbinding during depolarization. If a pore constriction is involved, similar to that proposed to occur during P/C-type inactivation, this would imply that closed-state inactivation in Kv1.5 occurs under acidic conditions.


Figures

FIGURE 1
FIGURE 1
Ba2+ blocks Kv1.5 in a concentration- and frequency-dependent manner. (A) With 0 mM formula image pHo 7.4 solution, 10-ms test pulses to +50 mV were applied at 1 Hz without (uppermost trace) and with 5 mM Ba2+. Shown are 65 consecutive traces from the time of Ba2+ application, which began immediately after the control trace. (Inset) The trace at the steady-state level of block was scaled 1.87× to match the peak amplitude of the control current. There was a small effect of Ba2+ on the onset of the K+ current. (B (i)) Trace 1 was recorded using a 10-ms pulse to +50 mV after a 1-min exposure to 1 mM Ba2+ in 0 mM formula image at −80 mV. Traces 2–5 show the current from subsequent pulses applied at 1 Hz in the continued presence of Ba2+. Trace 25 shows the steady-state current in 1 mM Ba2+ with 1 Hz stimulation and Trace 100 is the steady-state current after recovery in 0 mM Ba2+. (B (ii)) Traces 1–5 and 25 are normalized with respect to Trace 100. There was a marked slowing of the rising phase of the current elicited by the first pulse after Ba2+ exposure, but this effect is diminished with subsequent pulses in the continued presence of Ba2+. (C) The time course of the onset and offset of the Ba2+ block. The average current amplitude in the last 1 ms of each pulse was normalized to the Ba2+-free control current. Down and up arrows indicate the time of fast Ba2+ application and withdrawal, respectively. Black circles (•) represent the normalized current amplitudes for the experiment shown in A. Single-exponential fits to the onset of and recovery from Ba2+ block give τblock = 6.84 s and τunblock = 19.21 s, respectively. When the experiment was performed with the same stimulus protocol but with 20 mM Ba2+ (solid triangles), block onset was slightly faster (τblock = 4.97 s) and the normalized steady-state current was smaller (0.37 vs. 0.50 for 5 mM Ba2+), but the time course of current recovery was the same. If the [Ba2+] was kept constant at 5 mM but the pulse frequency decreased to 0.2 Hz (open diamonds), the normalized steady-state level was also reduced (steady-state normalized current = 0.27). Although the onset of the block was not affected by the decrease in stimulation frequency, recovery with a 0.2-Hz pulse frequency was much slower (τunblock = 63.20 s) than that seen at 1 Hz. (D) The blocking rate (1/τblock) is a nonlinear function of the [Ba2+]. τblock values were assessed in 0 mM formula image with 10-ms pulses to +50 mV applied at 1 Hz. The solid line represents the best fit of the data to a sequential two-site binding model (Eq. 1; see text for fit parameters). Data points are from a total of 46 cells, 3–8 cells/point. (E) The unblocking rate is linearly related to the pulse frequency. Values for τunblock were assessed with 0 mM formula image and 20 mM formula image using 10-ms pulses to +50 mV applied at 1, 0.7, 0.2, 0.066, or 0.033 Hz. The extrapolated off rate without pulsing (0 Hz) is 0.001 ± 0.002 s−1. Data points are from a total of 53 cells, 5–24 cells/point.
FIGURE 2
FIGURE 2
Sequence alignment of hKv1.5 and Shaker from the C-terminal end of S5 to the end of the selectivity filter. The putative regions forming the turret, pore helix, and selectivity filter are shown.
FIGURE 3
FIGURE 3
The steady-state level of Ba2+ block is dependent on the stimulation frequency and the [Ba2+]. Test pulses to +50 mV for 10 ms were applied at either 30-s intervals (0.033 Hz (open circles)) or 1.43-s intervals (0.7 Hz (solid circles)) with 0 formula image and a pHo of 7.4. Ba2+ was applied at various concentrations using a computer-controlled fast perfusion system. The steady-state residual current (1 − proportion of blocked (PB,SS)) at the end of the test pulse was normalized to the control test current before Ba2+ application and plotted against the concentration of Ba2+ applied (2 μM – 20 mM). The black solid lines represent the best fits of the two data sets to the Hill equation. Estimates of the apparent KBa,d and the Hill coefficient are 20.3 ± 2.6 μM and 1.12, respectively, for the data collected at 0.033 Hz, whereas the estimates from the 0.7 Hz data are 361 ± 151 μM and 1.16, respectively. Gray dashed lines represent the outcome of a simultaneous fit of the two data sets to Eq. 4. From the fit, k2, KBa,s, k2, and τd were estimated to be 0.15 s−1, 0.8 mM, 0.0006 s−1, and 59 ms, respectively (see text). The dotted gray line represents the solution for the residual normalized current (1 − Pr), where Pr is the proportion of channels blocked after a prolonged rest at the holding potential, i.e., at 0 Hz. A fit of 1 – Pr to the Hill equation gave a Hill coefficient of 1 and a KBa,d of 4 μM, indicating that the apparent KBa,d is profoundly affected by the pulse frequency. Data points are from a total of 29 cells (2–8 cells/point) for the 0.7 Hz data; and 45 cells (3–9 cells/point) for the 0.033 Hz data.
FIGURE 4
FIGURE 4
A model of the frequency-dependent Ba2+ binding replicates the time dependence of block onset and reversal. (A) A representative experiment in which a cell was given four 10-ms test pulses to +50 mV in 0 mM Ba2+ before a rapid changeover to 0.2 mM Ba2+ while test pulses continued to be applied at 0.1 Hz (open circles). After steady-state block was achieved, the pulse frequency was decreased to 0.033 Hz (open squares) and the block was allowed to reach a new steady state. The enhanced steady-state block observed with 0.033-Hz stimulus frequency was reversed upon reverting to 0.1-Hz pulses. The effects of changing the pulse frequency to 0.2 (○), 0.5 (Δ) and 0.7 (◊) Hz were subsequently examined using the same approach. Data points show current amplitudes normalized to the peak current at the end of the initial control test pulses. (B) Plot of simulated proportion of residual normalized current (1 – PB,x) at the end of each test pulse shown in A, calculated using Eq. 5 and the values for k2, KBa,s,, k2, and τd derived from fits to the data of Fig. 3. The values for td, tr, and τr were those derived from Fig. 3 (see text), whereas Pinitial of Eq. 5 is 1 − the proportion of current at the end of the preceding pulse train. At each stimulus frequency, the numerical simulation provides a good estimate both of the steady-state level of block and the time course of the relaxation to that steady state.
FIGURE 5
FIGURE 5
Fast application of Ba2+ during a long depolarizing pulse reveals very weak open-channel block by 20 mM Ba2+. Current traces in response to depolarizing pulses to +50 mV for 10 s in 0 mM formula image Ba2+-free solution (black trace) and with a rapid application and withdrawal of a 0 mM formula image 20 mM Ba2+ solution during a subsequent pulse (gray trace). Down and up arrows indicate the start and end of the Ba2+ application, respectively. Exposure to Ba2+ caused a rapid fall in current amplitude of ∼10%. A similar effect was observed in six other cells.
FIGURE 6
FIGURE 6
Ba2+ unbinding from the open state is voltage-dependent and inhibited by increasing the [K+]o. (A) Schematic of voltage-pulse and Ba2+ application protocol. A 1.5 s pulse to +50 mV was applied under 0.5 mM [K+]o, pHo 7.4 conditions. The cell was then exposed to 5 mM Ba2+ for 2 min, followed by a 4-min wash in control solution, after which the test pulse was repeated. (B) After Ba2+ exposure (gray trace), the current activation was much slower and well fitted by a single exponential (τact,app = 28.14 ms; compare to τact = 1.25 ms for the control response (black trace). (Inset) Current activation on an expanded timescale. These results are representative of those obtained from 11 cells. (C) Normalized currents after a 2-min exposure to 5 mM Ba2+ (with 0.5 mM formula image) recorded at two different test-pulse potentials. The activation time course at both voltages was well fitted by a single exponential. At +50 mV, τact,app was 22.56 ± 1.25 ms (n = 11), which was significantly faster (p < 0.001) than at +25 mV (τact,app = 65.59 ± 7.33 ms; n = 3). Each trace was normalized with respect to its own peak current. (D) Plot of the Ba2+ off rate (1/τact,app) derived from experiments such as those described in C, obtained between 0 and +100 mV in 25-mV increments. A fit of the data to the Woodhull model (see Methods) gave an estimate for δBa,off of 0.51 ± 0.04. Data points are from a total of 21 cells; 3–11 cells/point. (E) After Ba2+ loading (in 0.5 mM formula image), the time course of the current onset in 0.5 mM or 10 mM formula image was examined. The current activated significantly faster with 0.5 mM formula image (τact,app = 22.56 ± 1.25 ms; n = 11) than with 10 mM formula image (τact,app = 145.40 ± 6.15 ms; n = 5; p < 0.001). Traces were normalized as in C. (F) Plot of the Ba2+ off rate under varying [K+]o at a test-pulse potential of +50 mV. The best fit of the data to the Hill equation (see Methods) gave a KD for the formula image inhibition of Ba2+ unbinding of 1.00 ± 0.08 mM. Data points are from a total of 31 cells, 5–11 cells/point.
FIGURE 7
FIGURE 7
Low pHo inhibits both Ba2+ binding and unbinding from Kv1.5. (A) Diary plot of normalized current amplitudes at the end of 10-ms pulses to +50 mV applied at 1 Hz. Experiments were started in 0 mM formula image pH 7.4 bath solution. Rapid switching to pH 5.5 solution caused a rapid fall of the current amplitude. Subsequent application of 20 mM Ba2+ (down arrow), still at pH 5.5, caused a further small decline. The rapid return (up arrow) to Ba2+-free, pHo 7.4 solution resulted in a quick recovery of current amplitude (τrecov = 3.1 s), which would not be expected had Ba2+ accessed the deep pore site. (B) In the converse of the experiment shown in A, 20 mM Ba2+ was applied (down arrow) at pHo 7.4, resulting in 71% block of current, and was followed by a rapid wash-off of Ba2+ (up arrow) with pH 5.5 solution that caused an almost complete loss of current. Fast change of the bath solution back to pH 7.4 caused a rapid component of current recovery, followed by a large slow component (64% of total recovery) with a time constant of 23.6 s. These results are consistent with the interpretation that the proportion of Ba2+-loaded channels is not affected by high-frequency pulsing when the pHo is low.

Similar articles

Cited by

References

    1. Fedida, D., B. Wible, Z. Wang, B. Fermini, F. Faust, S. Nattel, and A. M. Brown. 1993. Identity of a novel delayed rectifier current from human heart with a cloned K+ channel current. Circ. Res. 73:210–216. - PubMed
    1. Feng, J., B. Wible, G. R. Li, Z. Wang, and S. Nattel. 1997. Antisense oligodeoxynucleotides directed against Kv1.5 mRNA specifically inhibit ultrarapid delayed rectifier K+ current in cultured adult human atrial myocytes. Circ. Res. 80:572–579. - PubMed
    1. Kehl, S. J., C. Eduljee, D. C. Kwan, S. Zhang, and D. Fedida. 2002. Molecular determinants of the inhibition of human Kv1.5 potassium currents by external protons and Zn2+. J. Physiol. 541:9–24. - PMC - PubMed
    1. Fedida, D., S. Zhang, D. C. Kwan, C. Eduljee, and S. J. Kehl. 2005. Synergistic inhibition of the maximum conductance of Kv1.5 channels by extracellular K+ reduction and acidification. Cell Biochem. Biophys. 43:231–242. - PubMed
    1. Kwan, D. C., D. Fedida, and S. J. Kehl. 2006. Single channel analysis reveals different modes of Kv1.5 gating behavior regulated by changes of external pH. Biophys. J. 90:1212–1222. - PMC - PubMed