. 2008 Nov 1;95(9):4481-93.
doi: 10.1529/biophysj.108.134510. Epub 2008 Jul 25.

Experimental verification of the behavioral foundation of bacterial transport parameters using microfluidics

Affiliations

Experimental verification of the behavioral foundation of bacterial transport parameters using microfluidics

Tanvir Ahmed et al. Biophys J. .

Abstract

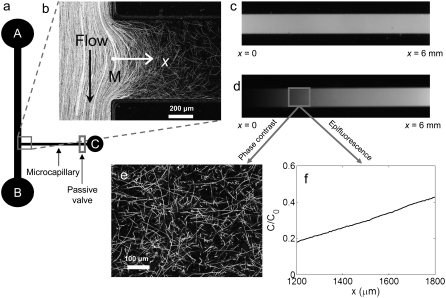
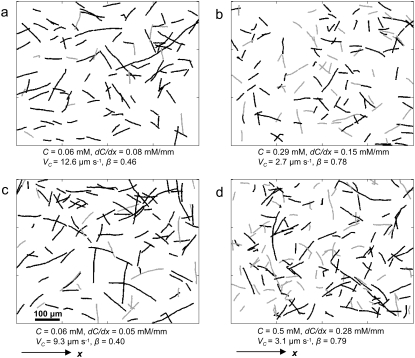
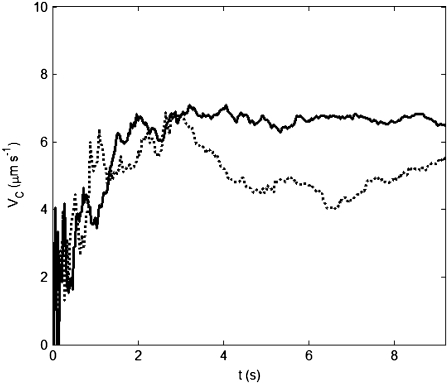
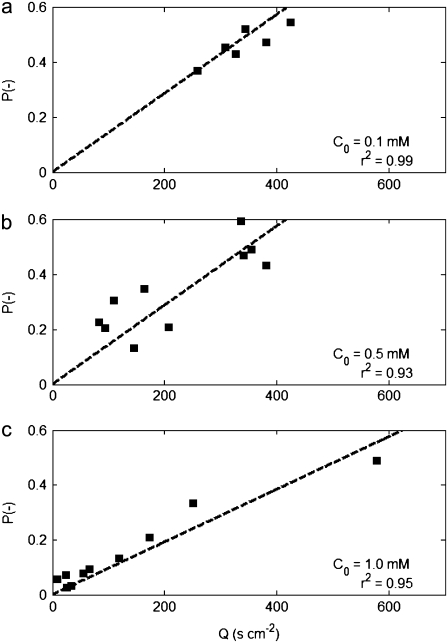
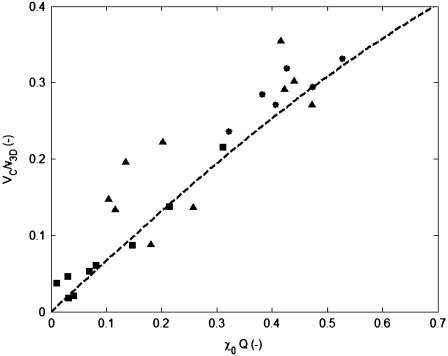
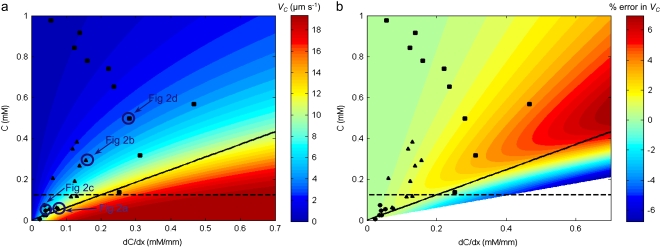
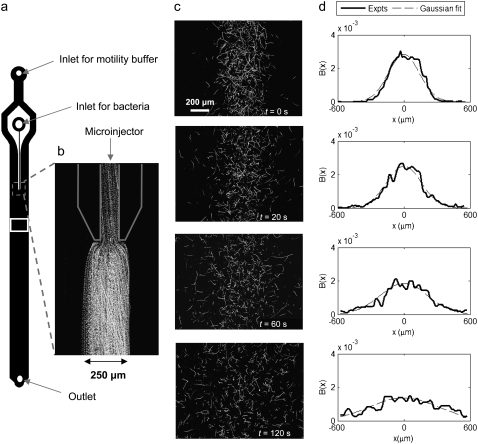
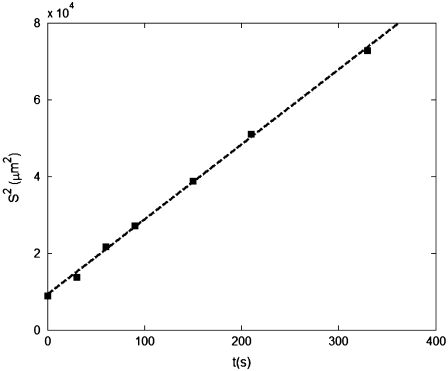
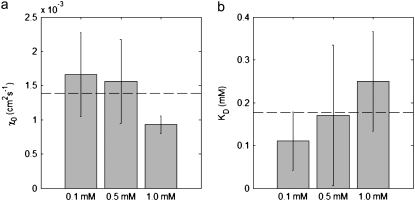
We present novel microfluidic experiments to quantify population-scale transport parameters (chemotactic sensitivity chi(0) and random motility mu) of a population of bacteria. Previously, transport parameters have been derived theoretically from single-cell swimming behavior using probabilistic models, yet the mechanistic foundations of this upscaling process have not been verified experimentally. We designed a microfluidic capillary assay to generate and accurately measure gradients of chemoattractant (alpha-methylaspartate) while simultaneously capturing the swimming trajectories of individual Escherichia coli bacteria using videomicroscopy and cell tracking. By measuring swimming speed and bias in the swimming direction of single cells for a range of chemoattractant concentrations and concentration gradients, we directly computed the chemotactic velocity VC and the associated chemotactic sensitivity chi(0). We then show how mu can also be readily determined using microfluidics but that a population-scale microfluidic approach is experimentally more convenient than a single-cell analysis in this case. Measured values of both chi(0) [(12.4 +/- 2.0) x 10(-4) cm(2) s(-1)] and mu [(3.3 +/- 0.8) x 10(-6) cm(2) s(-1)] are comparable to literature results. This microscale approach to bacterial chemotaxis lends experimental support to theoretical derivations of population-scale transport parameters from single-cell behavior. Furthermore, this study shows that microfluidic platforms can go beyond traditional chemotaxis assays and enable the quantification of bacterial transport parameters.


Figures

FIGURE 1
FIGURE 1
Experiments to determine the chemotactic sensitivity χ0 of E. coli. (a) Schematic of the microfluidic channel. Chemoattractant and fluorescein were injected in the microcapillary via inlet C by means of a passive valve. (b) Flow in the main channel (from A to B) was used to transport E. coli past the mouth (M) of the microcapillary, where a fraction of the population had swum into the microcapillary. Each white path is an E. coli trajectory. The image is a superposition of 200 frames captured over 6.2 s. (c and d) Epifluorescence images (using a 2× objective) of the microcapillary, initially filled uniformly with α-methylaspartate (t = 0; c), and later exhibiting a nonuniform concentration profile (t = 45 min; d). The latter was used to probe the chemotactic response of the E. coli cells that had swum into the microcapillary. 100 μM fluorescein was added to variable concentrations of α-methylaspartate (0.1, 0.5, or 1.0 mM) for visualization. (e) Trajectories of E. coli from 300 frames recorded over 9.4 s using a 20× objective. (f) Concentration profile C(x) obtained from d and normalized by the initial concentration C0 in the microcapillary. The field of view is the same as in e.
FIGURE 2
FIGURE 2
Digitized trajectories of E. coli corresponding to different combinations of chemoattractant concentration C and concentration gradient dC/dx. Concentration increased along x. Black (gray) trajectories had a net positive (negative) displacement in the direction of the gradient and contributed to the total cumulative time T+ (T) cells spent traveling up (down) the gradient. (a and c) CKD (KD = 0.125 mM): most cells had swum up the gradient, resulting in a small swimming direction asymmetry β and a large chemotactic velocity VC. (b and d) CKD: receptors saturated, chemotaxis diminished, and trajectories were nearly equally partitioned between up and down the gradient.
FIGURE 3
FIGURE 3
The chemotactic velocity VC as a function of time t elapsed in a movie to test for convergence of VC as described in the text. The solid line shows an experiment where VC converged to 7.1 μm s−1, and the dotted line corresponds to a run where VC did not converge. The latter case was discarded from further analysis. The cumulative trajectory time for the two cases was 907 and 494 s, respectively. A recording time of 9.4 s was typically sufficient to ensure convergence, and only 2 out of 28 experiments failed to converge.
FIGURE 4
FIGURE 4
Determination of the chemotactic sensitivity coefficient χ0, for three initial concentrations C0: (a) 0.1 mM; (b) 0.5 mM; (c) 1.0 mM. Each square represents one experiment. Here P = tanh−1(3πVC/8v2D), Q = π/(8v2D)[KD/(KD + C)2]dC/dx and the slope P/Q corresponds to χ0 (Eq. 10). A least-square linear fit constrained to go through the origin (dashed line) gave χ0 = 13.5 × 10⁻⁴, 14.3 × 10⁻⁴, and 9.6 × 10⁻⁴ cm2 s−1 for the three cases, respectively. The average is χ0 = 12.4 × 10⁻⁴ cm2 s−1.
FIGURE 5
FIGURE 5
Observed values of the relative chemotactic velocity VC/v3D of E. coli toward α-methylaspartate, as a function of χ0Q (Eq. 10), where χ0 = 12.4 × 10⁻⁴ cm2 s−1 from the experiments. Symbols correspond to the three initial concentrations C0 = 0.1 (•), 0.5 (▴), and 1.0 mM (▪). The highest value of VC/v3D achieved in our experiments was 0.35. The dashed curve represents the theoretical prediction (Eq. 9), which plateaus at VC/v3D = 2/3 (not shown).
FIGURE 6
FIGURE 6
(a) The chemotactic velocity VC of E. coli exposed to α-methylaspartate as a function of the concentration C and concentration gradient dC/dx. VC was calculated from Eq. 9 using the experimentally determined values v2D = 29.8 μm s−1 and χ0 = 12.4 × 10⁻⁴ cm2 s−1. Symbols represent the experimental runs, separated based on initial chemoattractant concentration (•: C0 = 0.1 mM; ▴: C0 = 0.5 mM; ▪: C0 = 1.0 mM). Bacterial trajectories corresponding to four cases (circled symbols) are shown in Fig. 2. The dashed line indicates C = KD. The solid line represents C = (dC/dx) × v1D/acrit (with v1D = v3D/2 = 19 μm s−1 and acrit = 0.03 s−1 (52)). The parameter space below this line represents experimental conditions for which saturation of the adaptation response is expected (52). Only two points fall below the saturation line. (b) The error incurred in estimating VC (Eq. 9) using the mean nutrient concentration C over the entire field of view, expressed as a percentage deviation from the average VC calculated for a linearly varying concentration profile, as a function of C and dC/dx. Symbols and lines as in (a). The error is <4% for all experiments. In the white region comparison with a linear concentration scenario is not possible, as it would correspond to negative concentrations.
FIGURE 7
FIGURE 7
Experiments to determine the random motility μ of E. coli. (a) Schematic of the microfluidic channel. The observation region is marked by a white rectangle. (b) Close-up of the microinjector, showing the 250-μm-wide band of E. coli. The image is composed of 100 frames recorded over 3.1 s, and white tracks represent individual bacterial trajectories. (c) Bacterial trajectories at four times after the flow was stopped (t = 0), “releasing” the band of bacteria. Because no chemoattractant is present, lateral spreading is due to random motility alone. Images are acquired as in b. (d) Profiles of bacterial positions across the channel, B(x), along with the best Gaussian fit. Each profile was normalized to a total area of 1 and corresponds to the adjacent panel in c.
FIGURE 8
FIGURE 8
The squared standard deviation S2 of the across-channel bacterial distribution corresponding to the experiments in Fig. 7 d, as a function of time t elapsed since release of the bacterial band. The dashed line represents the best linear fit, and its slope is 2μ. This experiment yielded μ = 3.6 × 10⁻⁶ cm2 s−1. The average random motility over nine experiments was μ = 3.3 × 10⁻⁶ cm2 s−1.
FIGURE 9
FIGURE 9
Simultaneous determination of (a) χ0 and (b) KD, obtained by the nonlinear fitting of Eq. 9 to the experimental data for the initial conditions C0 = 0.1, 0.5, and 1.0 mM. The dashed line represents the mean of the three sets of experiments, and the error bars indicate 95% confidence intervals.

References

    1. Koyama, S., D. Amarie, H. A. Soini, M. V. Novotny, and S. C. Jacobson. 2006. Chemotaxis assays of mouse sperm on microfluidic devices. Anal. Chem. 78:3354–3359. - PubMed
    1. Fauci, L. J., and R. Dillon. 2006. Biofluidmechanics of reproduction. Annu. Rev. Fluid Mech. 38:371–394.
    1. Pratt, L. A., and R. Kolter. 1998. Genetic analysis of Escherichia coli biofilm formation: roles of flagella, motility, chemotaxis and type I pili. Mol. Microbiol. 30:285–293. - PubMed
    1. O'Toole, G., H. B. Kaplan, and R. Kolter. 2000. Biofilm formation as microbial development. Annu. Rev. Microbiol. 54:49–79. - PubMed
    1. Duffy, K. J., R. M. Ford, and P. T. Cummings. 1997. Residence time calculation for chemotactic bacteria within porous media. Biophys. J. 73:2930–2936. - PMC - PubMed

Publication types

MeSH terms

Substances