. 2008 Nov 1;95(9):4403-15.
doi: 10.1529/biophysj.108.135863. Epub 2008 Jul 25.

Characterization of the control catabolite protein of gluconeogenic genes repressor by fluorescence cross-correlation spectroscopy and other biophysical approaches

Affiliations

Characterization of the control catabolite protein of gluconeogenic genes repressor by fluorescence cross-correlation spectroscopy and other biophysical approaches

Silvia Zorrilla et al. Biophys J. .

Erratum in

  • Biophys J. 2009 Feb;96(3):1232

Abstract

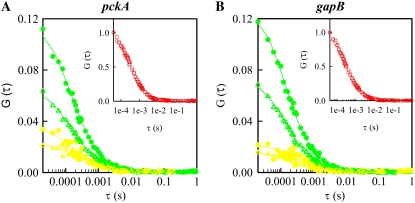
Determination of the physical parameters underlying protein-DNA interactions is crucial for understanding the regulation of gene expression. In particular, knowledge of the stoichiometry of the complexes is a prerequisite to determining their energetics and functional molecular mechanisms. However, the experimental determination of protein-DNA complex stoichiometries remains challenging. We used fluorescence cross-correlation spectroscopy (FCCS) to investigate the interactions of the control catabolite protein of gluconeogenic genes, a key metabolic regulator in Gram-positive bacteria, with two oligonucleotides derived from its target operator sequences, gapB and pckA. According to our FCCS experiments, the stoichiometry of binding is twofold larger for the pckA target than for gapB. Correcting the FCCS data for protein self-association indicated that control catabolite protein of gluconeogenic genes forms dimeric complexes on the gapB target and tetrameric complexes on the pckA target. Analytical ultracentrifugation coupled with fluorescence anisotropy and hydrodynamic modeling allowed unambiguous confirmation of this result. The use of multiple complementary techniques to characterize these complexes should be employed wherever possible. However, there are cases in which analytical ultracentrifugation is precluded, due to protein stability, solubility, or availability, or, more obviously, when the studies are carried out in live cells. If information concerning the self-association of the protein is available, FCCS can be used for the direct and simultaneous determination of the affinity, cooperativity, and stoichiometry of protein-DNA complexes in a concentration range and conditions relevant to the regulation of these interactions.


Figures

FIGURE 1
FIGURE 1
Sequences of the DNA oligonucleotides used in our study, the gapB and pckA targets. Solid and dashed arrows represent the binding sites proposed by Servant et al. (25) and Licht et al. (28), respectively.
FIGURE 2
FIGURE 2
Representative examples of the auto- and cross-correlation profiles recovered from FCCS measurements of the interaction of fluorescein-labeled CcpN with the Atto 647N-labeled oligonucleotides bearing the pckA (A) and gapB (B) target sequences. Green, red, and yellow curves correspond to the autocorrelation traces recorded in the green and red channels and the cross-correlation curve, respectively. The total concentration of CcpN was either 468 nM (closed circles) or 800 nM (open triangles). The concentration of DNA was 5 nM. In the insets, the autocorrelation traces recorded in the red channel at 0 (open circles) and 1.3 (open squares) μM repressor are plotted. Solid lines correspond to best fits of the curves to the models discussed in the main text.
FIGURE 3
FIGURE 3
FCCS-based titrations of the Atto 647N-labeled gapB (triangles) and pckA (circles) target oligonucleotides, with the fluorescein-labeled repressor. Gx(0) and GG(0) are the amplitudes of the cross correlation and protein autocorrelation functions retrieved from the fitting of the profiles. The ratio Gx(0)/GG(0) represents the fraction of complex with respect to the total concentration of DNA, and the high concentration plateau of the curves is proportional to the stoichiometry of the complexes (see the main text). Solid lines correspond to the best fits of the data to the energetic models discussed in the main text. The concentration of DNA in the titrations was 5 nM.
FIGURE 4
FIGURE 4
Hydrodynamics of the free CcpN repressor in solution. (A) Sedimentation coefficient distributions determined for 1.3 μM TMR-CcpN (solid line) and for 30 μM nonlabeled CcpN (dashed line). The distributions shown have been corrected to standard conditions (20°C). (B) Low resolution hydrodynamic model built for CcpN dimer. The theoretical sedimentation coefficient of the modeled molecule is indicated. (C) Steady-state fluorescence anisotropy of Alexa 488-labeled CcpN as a function of protein concentration. The solid line in the graph corresponds to the fit of the binding isotherm to a monomer-dimer model. λexc = 495 and λem = 520. (D) Fluorescence anisotropy decay determined for Alexa 488-labeled CcpN at 1 μM total protein concentration. The fit shown corresponds to a triexponentional model (see the main text). λexc = 460 and λem = 520.
FIGURE 5
FIGURE 5
Sedimentation coefficient distributions recovered for the complexes of the CcpN repressor with the target gapB and pckA oligonucleotides. (A) 2.8 μM fluorescein-labeled gapB (dashed) or pckA (solid) oligonucleotides in the absence (thin lines) and presence (thick lines) of a sevenfold molar excess of nonlabeled repressor. The distributions shown have been corrected for standard conditions (20°C). (B) Low resolution models of dimeric and tetrameric CcpN in complex with a 49 bp DNA oligonucleotide. The calculated sedimentation coefficients of the modeled complexes are indicated.
FIGURE 6
FIGURE 6
SE gradients recovered for samples containing CcpN repressor and the gapB and pckA target oligonucleotides. The gradients correspond to free gapB-Atto 647N (A), free pckA-Atto 647N (B), and CcpN complexes with gapB-Fl (C) and pckA-Fl (D). The concentration of free Atto 647N-labeled DNA was 1.5 μM. In the complexes, the concentration of DNA was 2.8 μM and the protein/DNA ratio was 7:1 in monomer units. Solid lines correspond to best fit of the data using one-component models for the free DNAs (A and B) and the two-species models discussed in the main text for the repressor/DNA mixtures (C and D).

References

    1. Kim, S. A., K. G. Heinze, K. Bacia, M. N. Waxham, and P. Schwille. 2005. Two-photon cross-correlation analysis of intracellular reactions with variable stoichiometry. Biophys. J. 88:4319–4336. - PMC - PubMed
    1. Swift, J. L., R. Heuff, and D. T. Cramb. 2006. A two-photon excitation fluorescence cross-correlation assay for a model ligand-receptor binding system using quantum dots. Biophys. J. 90:1396–1410. - PMC - PubMed
    1. Hwang, L., and T. Wohland. 2004. Dual-color fluorescence cross-correlation spectroscopy using single laser wavelength excitation. ChemPhysChem. 5:549–551. - PubMed
    1. Rippe, K. 2000. Simultaneous binding of two DNA duplexes to the NtrC-enhancer complex studied by two-color fluorescence cross-correlation spectroscopy. Biochemistry. 39:2131–2139. - PubMed
    1. Strohner, R., M. Wachsmuth, K. Dachauer, J. Mazurkiewicz, J. Hochstatter, K. Rippe, and G. Langst. 2005. A ‘loop recapture’ mechanism for ACF-dependent nucleosome remodeling. Nat. Struct. Mol. Biol. 12:683–690. - PubMed

Publication types

MeSH terms

LinkOut - more resources