. 2008 Nov 1;95(9):4426-38.
doi: 10.1529/biophysj.108.132217. Epub 2008 Jul 25.

Substrate modulus directs neural stem cell behavior

Affiliations

Substrate modulus directs neural stem cell behavior

Krishanu Saha et al. Biophys J. .

Abstract

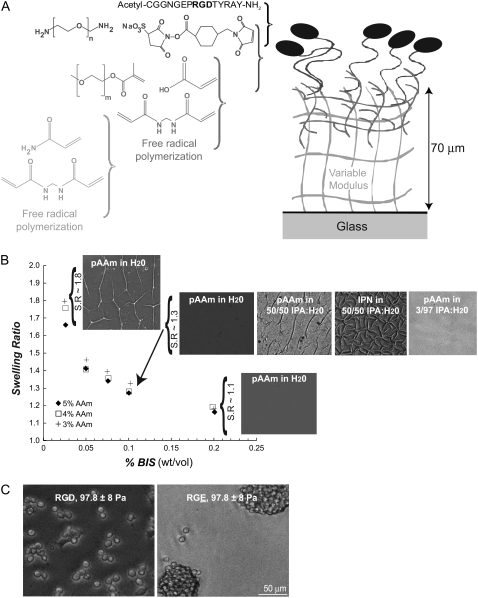
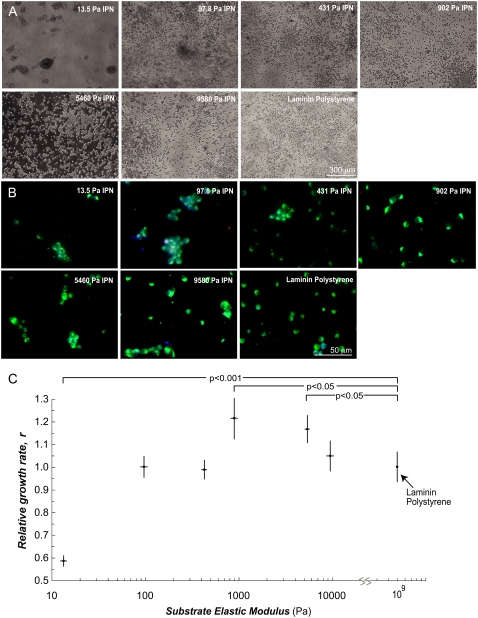
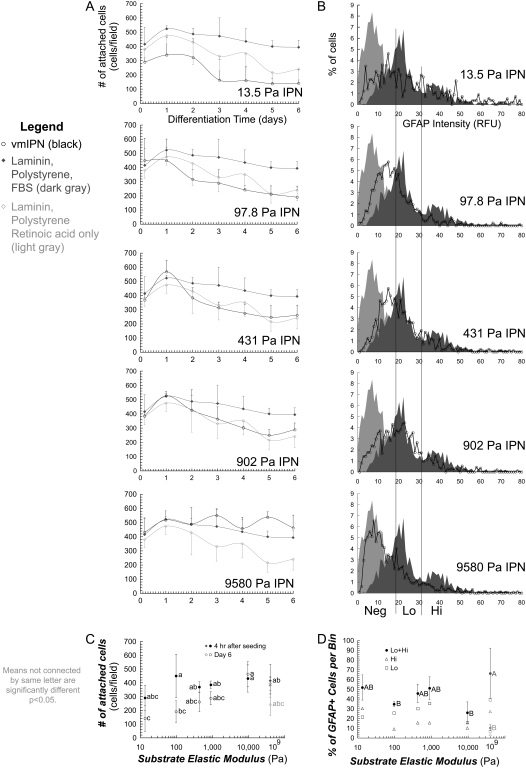
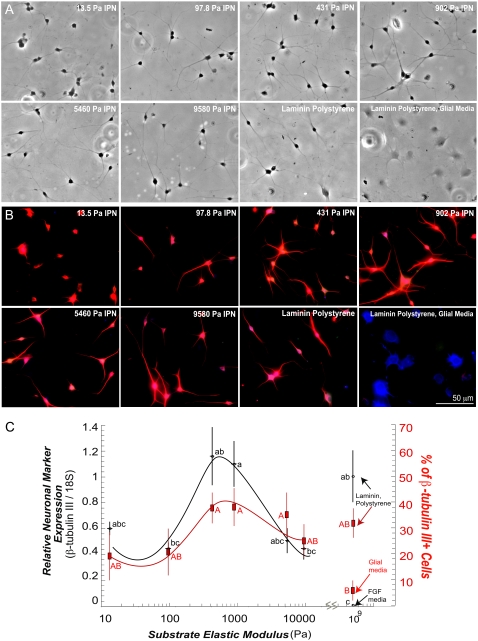
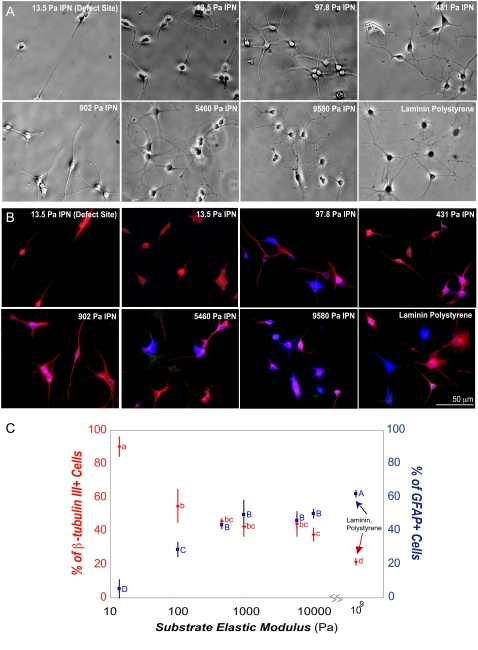
Although biochemical signals that modulate stem cell self-renewal and differentiation were extensively studied, only recently were the mechanical properties of a stem cell's microenvironment shown to regulate its behavior. It would be desirable to have independent control over biochemical and mechanical cues, to analyze their relative and combined effects on stem-cell function. We developed a synthetic, interfacial hydrogel culture system, termed variable moduli interpenetrating polymer networks (vmIPNs), to assess the effects of soluble signals, adhesion ligand presentation, and material moduli from 10-10,000 Pa on adult neural stem-cell (aNSC) behavior. The aNSCs proliferated when cultured in serum-free growth media on peptide-modified vmIPNs with moduli of >/=100 Pa. In serum-free neuronal differentiation media, a peak level of the neuronal marker, beta-tubulin III, was observed on vmIPNs of 500 Pa, near the physiological stiffness of brain tissue. Furthermore, under mixed differentiation conditions with serum, softer gels ( approximately 100-500 Pa) greatly favored neurons, whereas harder gels ( approximately 1,000-10,000 Pa) promoted glial cultures. In contrast, cell spreading, self-renewal, and differentiation were inhibited on substrata with moduli of approximately 10 Pa. This work demonstrates that the mechanical and biochemical properties of an aNSC microenvironment can be tuned to regulate the self-renewal and differentiation of aNSCs.


Figures

FIGURE 1
FIGURE 1
Synthesis of a vmIPN and characterization. (A) Schematic of sequential polymerizations and grafting chemistry used to synthesize the vmIPN. Drawing not to scale. Molecular weights of the CH2CH2O repeat for m and n are 1000 and 3400, respectively. (B) Swelling behavior of first poly(acrylamide) (pAAm) layer in water. Swelling ratio (S.R.) is calculated as in Table 1. After swelling in water, surface features appeared in the first vmIPN pAAm layer of low moduli (e.g., <1000 Pa for 10 wt% gels) which have high swelling ratios. The pAAm layers shown at S.R.∼1.8 were 13.5 ± 1 Pa. After 10 min in a 50/50 v/v water:isopropyl alcohol (IPA) solution, surface morphology was altered in the first vmIPN pAAm layer of low moduli (e.g, <1000 Pa for 10 weight % gels) which have high swelling ratios. After the second polymerization of the vmIPN, surface features persisted in 50:50 v/v isopropyl alcohol (IPA)/water solvent conditions, but were absent in 3:97 v/v IPA/water solvent conditions. (C) The aNSC response was specific to peptide ligand on vmIPNs. The aNSCs adhere and proliferate on bsp-RGD(15) peptide-modified vmIPNs, whereas they form nonadherent cell aggregates on bsp-RGE(15) peptide-modified vmIPNs. Both substrates have an elastic modulus of 97.8 ± 8 Pa (Table 1). These phase-contrast images were taken after 3 days of culture in FGF-2 proliferating media conditions.
FIGURE 2
FIGURE 2
The aNSCs self-renew on vmIPNs of ≥100 Pa. (A) Phase-contrast images of aNSCs on vmIPNs in media conditions that promoted self-renewal (20 ng/mL FGF-2). (B) Immunocytochemistry confirmed that all cells contained the progenitor cell marker, nestin (green), and low levels of β-tubulin III (red) and GFAP (blue), which appear as faintly purple cells. (C) Growth rate of undifferentiated stem cells as a function of substrate elastic modulus. The aNSC number with time on vmIPNs was fit to a Verhulst logistic growth model (n = 3). Growth rates are normalized to laminin polystyrene substrates (r = 0.33–0.39 1/h; doubling time, 1/r = 25–30 h; carrying capacity, 6.6 × 10⁵ cells/cm2 or 3800 cells per image). Error bars are 95% confidence intervals, and p-values <0.05, based on Student's t-test under laminin-coated polystyrene surface conditions, are shown.
FIGURE 3
FIGURE 3
The aNSCs differentiate on vmIPNs into glia over a wide range of moduli. (A) Phase-contrast images of aNSCs 4 h after seeding onto various substrates in glial media conditions (1 v/v % fetal bovine serum). Shown also are control conditions with neuronal media on laminin-coated polystyrene substrates (1 μM retinoic acid and 5 μM forskolin; no serum). (B) Phase-contrast images of aNSCs after 6 days of differentiation in glial media conditions. (C) Immunostaining of aNSCs after 6 days of differentiation in glial media conditions. Cell lineage markers: progenitor cell marker nestin (green), mature neuronal marker β-tubulin III (red), and astrocytic marker GFAP (blue).
FIGURE 4
FIGURE 4
Survival and maturity of glial cell types are modestly affected by substrate modulus. (A) Number of attached cells on various substrates, differentiated under glial media conditions (1 v/v % fetal bovine serum), black in all plots. In all plots, dark gray is laminin-coated polystyrene. Shown also are control conditions with neuronal media on laminin-coated polystyrene substrates (1 μM retinoic acid + 5 μM forskolin; no serum), which are light gray in all plots. (B) Histograms indicate number of cells at particular GFAP staining intensities. All images were taken after 6 days of culture. (C) Summary of A. Number of attached cells as a function of modulus at 4 h after seeding, and after 6 days of differentiation. (D) Summary of B. Percentage of cells that stained positive for GFAP for each intensity bin. For A, C, and D, error bars are 95% confidence intervals. Means with same group letter are not significantly different from each other (analysis of variation Tukey-Kramer test, p < 0.05). Note the log x-axis in C and D.
FIGURE 5
FIGURE 5
The aNSCs differentiate on vmIPNs into neurons at ∼500 Pa. (A) Phase-contrast images of aNSCs differentiated under neuronal differentiation conditions (1 μM retinoic acid and 5 μM forskolin). On ∼10-Pa vmIPNs only, defect sites are created because of high swelling (see Results). Cells on such sites are excluded from image analysis in C. (B) Immunostaining of aNSCs differentiated under neuronal differentiation conditions. Cell lineage markers: progenitor cell marker nestin (green), mature neuronal marker β-tubulin III (red), and astrocytic marker GFAP (blue). (C) On left axis, β-tubulin III expression as a function of substrate modulus was assayed by QRT-PCR (n = 5–6). Note the log x-axis and peak in β-tubulin III near 500 Pa. On right axis (red), the percentage of cells that fell above a threshold of β-tubulin III intensity (red in b) is shown. Error bars are 95% confidence intervals. Means with same group letter are not significantly different from each other (analysis of variation Tukey-Kramer test, p < 0.05). The QRT-PCR value for the ∼10-Pa vmIPN includes cells on surface defects, and therefore likely overestimates β-tubulin III expression. All images were taken after 6 days of culture. Glial media label indicates DMEM/N-2 media supplemented with only 1 v/v % FBS on laminin-coated polystyrene.
FIGURE 6
FIGURE 6
The proportion of neurons versus glia under mixed differentiation is a strong function of modulus. (A) Phase-contrast images of aNSCs differentiated under mixed glial and neuronal differentiation conditions (1 μM retinoic acid and 1 v/v % fetal bovine serum). (B) Immunostaining of aNSCs differentiated under mixed differentiation conditions. Cell-lineage markers: progenitor cell marker nestin (green), mature neuronal marker β-tubulin III (red), and astrocytic marker GFAP (blue). (C) Percentage of cells that stained positive for β-tubulin III (red) is on left axis, and for GFAP (blue), on right axis. Error bars are 95% confidence intervals. Means with same group letter are not significantly different from each other (analysis of variation Tukey-Kramer test, p < 0.05). Note the log x-axis. All images were taken after 6 days of culture.

References

    1. Bard, J. B., and E. D. Hay. 1975. The behavior of fibroblasts from the developing avian cornea. Morphology and movement in situ and in vitro. J. Cell Biol. 67:400–418. - PMC - PubMed
    1. Hay, E. D. 1982. Interaction of embryonic surface and cytoskeleton with extracellular matrix. Am. J. Anat. 165:1–12. - PubMed
    1. Nakagawa, S., P. Pawelek, and F. Grinnell. 1989. Extracellular matrix organization modulates fibroblast growth and growth factor responsiveness. Exp. Cell Res. 182:572–582. - PubMed
    1. Halliday, N. L., and J. J. Tomasek. 1995. Mechanical properties of the extracellular matrix influence fibronectin fibril assembly in vitro. Exp. Cell Res. 217:109–117. - PubMed
    1. Pelham, R. J., Jr., and Y. Wang. 1997. Cell locomotion and focal adhesions are regulated by substrate flexibility. Proc. Natl. Acad. Sci. USA. 94:13661–13665. - PMC - PubMed

Publication types