. 2008 Sep;36(15):4988-99.
doi: 10.1093/nar/gkn469. Epub 2008 Jul 25.

60S ribosomal subunit assembly dynamics defined by semi-quantitative mass spectrometry of purified complexes

Affiliations

60S ribosomal subunit assembly dynamics defined by semi-quantitative mass spectrometry of purified complexes

Alice Lebreton et al. Nucleic Acids Res. 2008 Sep.

Abstract

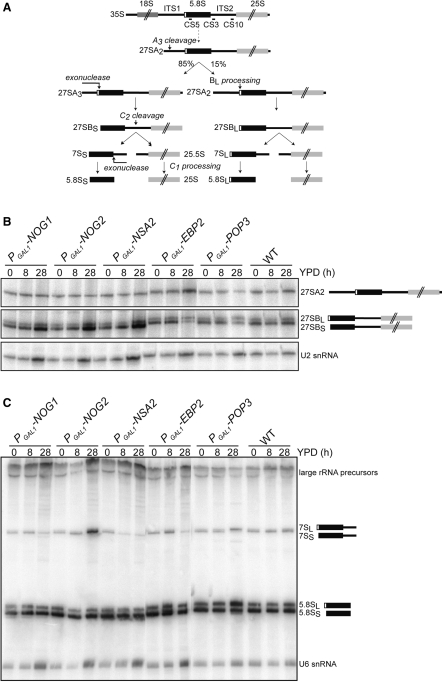
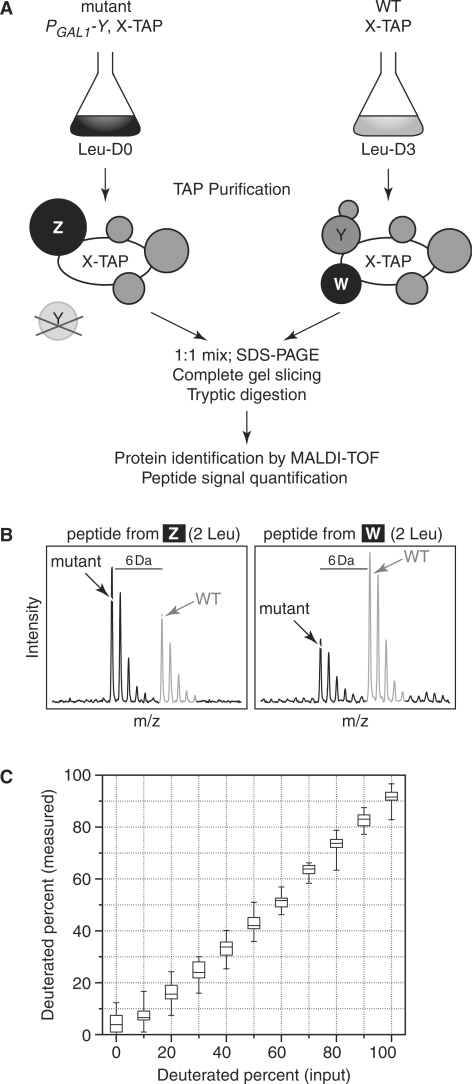
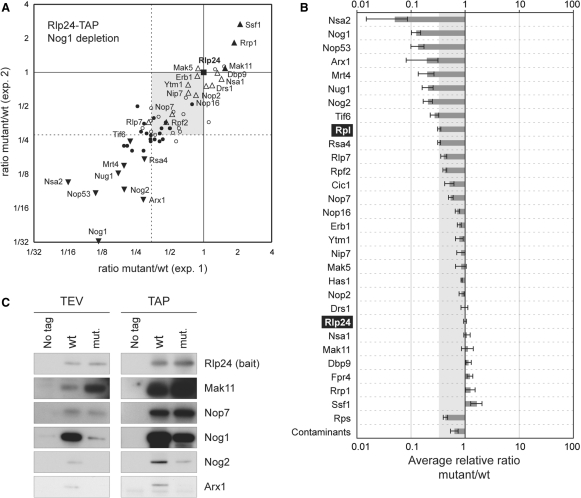
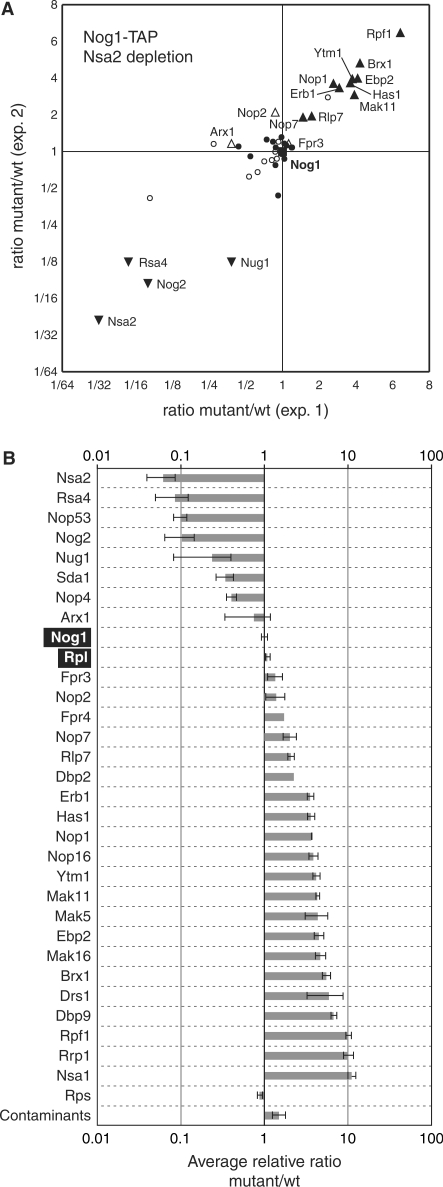
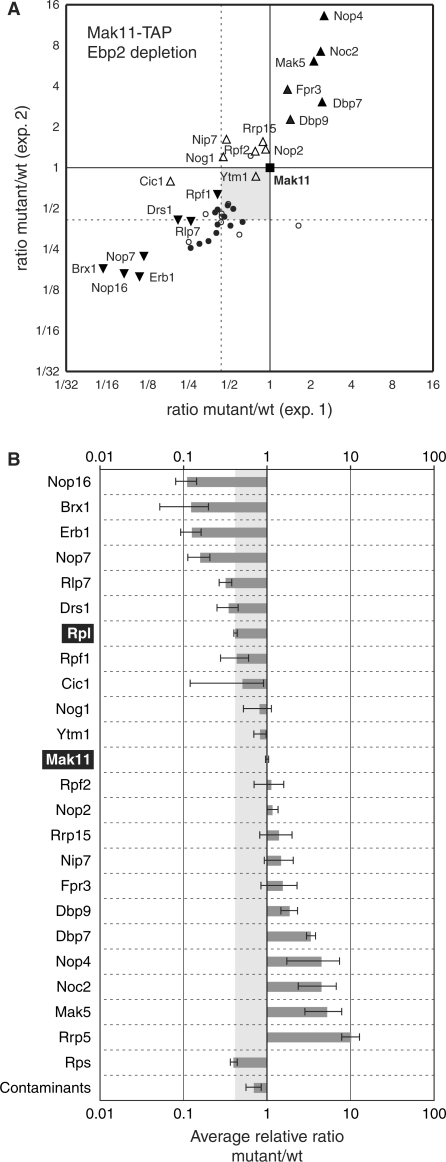
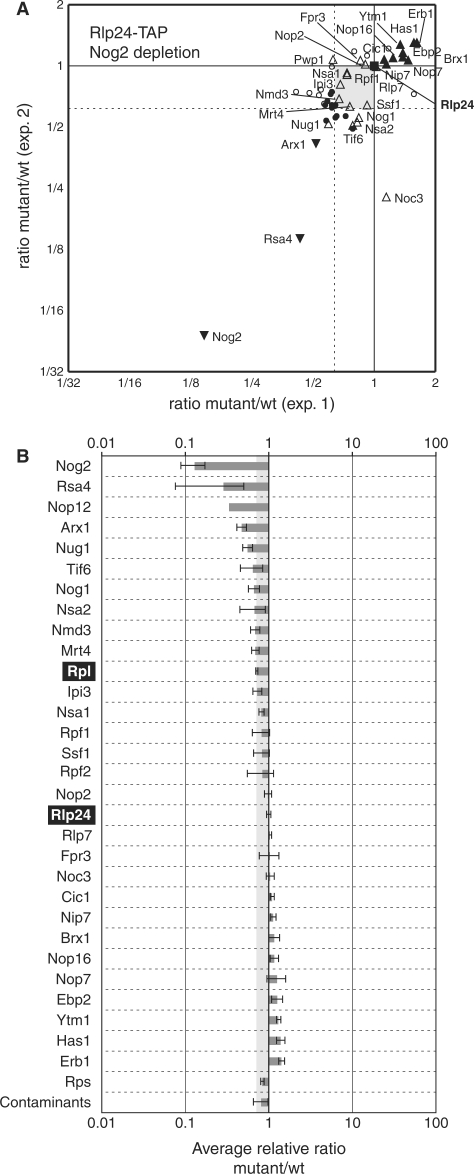
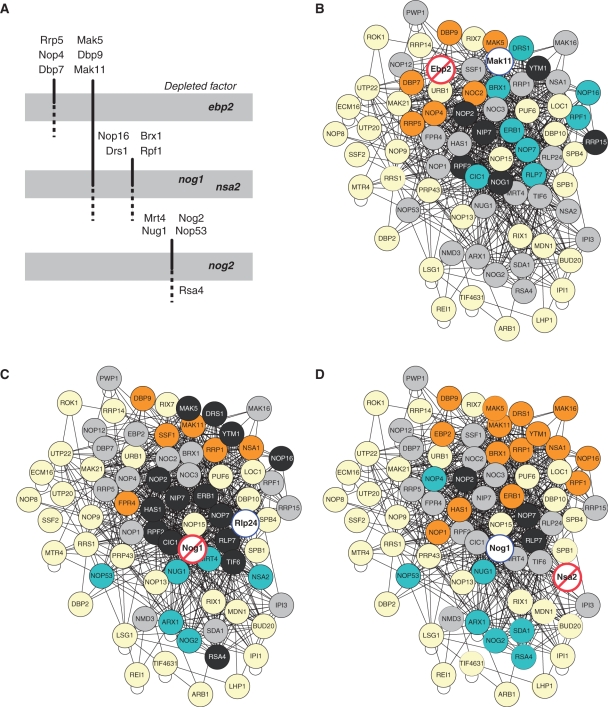
During the highly conserved process of eukaryotic ribosome formation, RNA follows a maturation path with well-defined, successive intermediates that dynamically associate with many pre-ribosomal proteins. A comprehensive description of the assembly process is still lacking. To obtain data on the timing and order of association of the different pre-ribosomal factors, a strategy consists in the use of pre-ribsomal particles isolated from mutants that block ribosome formation at different steps. Immunoblots, inherently limited to only a few factors, have been applied to evaluate the accumulation or decrease of pre-ribosomal intermediates under mutant conditions. For a global protein-level description of different 60S ribosomal subunit maturation intermediates in yeast, we have adapted a method of in vivo isotopic labelling and mass spectrometry to study pre-60S complexes isolated from strains in which rRNA processing was affected by individual depletion of five factors: Ebp2, Nog1, Nsa2, Nog2 or Pop3. We obtained quantitative data for 45 distinct pre-60S proteins and detected coordinated changes for over 30 pre-60S factors in the analysed mutants. These results led to the characterisation of the composition of early, intermediate and late pre-ribosomal complexes, specific for crucial maturation steps during 60S assembly in eukaryotes.


Figures

Figure 1.
Figure 1.
(A) Schematic representation of the rRNA maturation pathway. The oligonucleotides used in this study are indicated. (B) Total RNAs were extracted from the different strains after growth in galactose-containing, synthetic complete medium or after shift to glucose medium for either 8 or 28 h. 27SA2 and 27SB rRNA intermediates were detected by primer extension using oligonucleotide CS10, on a 5% polyacrylamide-urea gel. The U2 snRNA was used as a loading control. (C) 7S intermediate and 5.8S mature rRNA were separated on 5% polyacrylamide-urea gel and detected by northern blot using 32P-labelled oligonucleotides CS3 or CS5. The U6 snRNA was used as a loading control.
Figure 2.
Figure 2.
Adaptation of SILAC to the quantitative analysis of pre-ribosomal complexes. (A) Schematics of the TAP-SILAC coupling for the quantitative analysis of protein composition changes. Two strains producing a TAP-tagged bait protein ‘X’, a wild type and a mutant expressing a glucose-repressible pre-ribosomal gene ‘Y’ are grown in glucose-containing minimal medium, either in presence of normal leucine, or in presence of deuterated leucine. X-TAP-associated complexes are purified by tandem affinity purification, then the wild type and mutant samples are mixed together and separated by SDS-PAGE. Specific protein bands are cut out from the gels and analysed by MALDI-TOF spectrometry. (B) The non-deuterated/deuterated ratio can be quantified for each identified peptide in a given protein, using the mass spectra. As an example, signals obtained with a peptide from protein ‘Z’, which accumulates in the mutant and a peptide from protein ‘W’, which is lost in complexes purified from the mutant strain were illustrated. (C) To test the performance of mass spectrometry quantification, total yeast protein extracts from cells grown in medium containing leucine or deuterated leucine were mixed in different ratios, with a percentage of deuterated proteins from 0% to 100%. After separation by SDS-PAGE, four bands at different molecular weights (range from 12–125 kDa) were recovered and proteins identified by MALDI-TOF mass spectrometry. Several peptide signals were quantified in the different samples (8–14 values, depending on the spectra quality) and a box and whiskers plot for the measured values were represented in correlation with the expected percentage of deuterated leucine-containing peptides. Boxes represent the upper and lower quartile, the horizontal line, the median and the bars represent the maximum and minimum measured values.
Figure 3.
Figure 3.
Rlp24-TAP combined with Nog1 depletion defines classes of pre-60S factors. (A) Scatter plot of the mutant/wild-type ratio obtained for each protein in two independent experiments where, in turn, the wild type or the mutant strain were cultivated in deuterated leucine-containing medium. Bait (Rlp24) is indicated by a filled square; Proteins enriched in the complexes purified from the mutant strain when using the bait protein as reference are indicated as upward pointing filled triangles; Proteins enriched or in similar amounts in the wild type and mutant complexes when using ribosomal proteins (Rpl) as reference are indicated as empty triangles; Proteins showing decreased levels in the complexes purified from the mutant strain (downward pointing filled triangles); Large ribosomal subunit proteins (filled circles); Contaminants (empty circles). Dashed lines indicate the average ratios obtained for large subunit r-proteins. (B) Quantifications of the mutant/wild-type ratios for proteins identified in Rlp24-TAP-associated complexes purified from strains expressing NOG1 or not. Boxes represent the average value of the ratio for all quantified peptides in a given protein in two distinct experiments. Error bars indicate 95% confidence intervals. (C) Immunoblot validation of the SILAC quantifications. Aliquots from Rlp24-TAP-associated complexes recovered from the wild type or the PGAL1-NOG1 strain were separated by SDS-PAGE and the amounts of Rlp24, Mak11, Nop7, Nog1, Nog2 or Arx1 were assessed by western blot using specific antibodies. Both the eluate from the first purification step on IgG-sepharose (TEV) and the final eluate (TAP) were analysed (left and right panels, respectively).
Figure 4.
Figure 4.
Nog1-TAP combined with the depletion of Nsa2 defines C2-specific 60S precursors. (A, B) Legends are as for Figure 3, except that the bait was Nog1, and the depleted protein, Nsa2.
Figure 5.
Figure 5.
Early 60S precursors, isolated in association with Mak11-TAP are enriched after Ebp2 depletion. (A, B) Legends are as for Figure 3, except that the bait was Mak11, and the depleted protein, Ebp2.
Figure 6.
Figure 6.
Modest changes in the composition of late nuclear pre-60S complexes are induced by Nog2 depletion. (A, B) Legends are as for Figure 3, with Rlp24 as the tagged protein and Nog2 as the depleted factor.
Figure 7.
Figure 7.
SILAC-based definition of pre-60S sub-complexes. (A) Based on the results of our analysis we deduced possible association and dissociation steps that define several groups of pre-60S factors, relative to the involvement of Ebp2, Nog1/Nsa2 and Nog2 in the rRNA maturation pathway. (B, C, D) The results of the SILAC quantifications were colour-coded and superposed on a Cytoscape representation of pre-60S proteins, showing identified bait–prey interactions from published affinity purification experiments. We first extracted a 60S-specific sub-network from the larger pre-ribosomal interactions network. The network layout was obtained by applying the yFiles organic algorithm in Cytoscape. The represented experiments are (B) Mak11-TAP, depletion of Ebp2, (C) Rlp24-TAP, depletion of Nog1 and (D) Nog1-TAP, depletion of Nsa2. The bait is framed by a blue line, and the depleted factor in a white disk dashed in red. Factors which were enriched in complexes isolated from the mutant strain at least by a factor of 2 are shown in orange, factors which were decreased by >50% are in cyan, factors of unchanged levels are in dark grey disks. Light grey disks indicate factors that we identified in at least one of our experiments. Light yellow disks correspond to known pre-60S factors which were not identified in the SILAC experiments.

References

    1. Dragon F, Gallagher JE, Compagnone-Post PA, Mitchell BM, Porwancher KA, Wehner KA, Wormsley S, Settlage RE, Shabanowitz J, Osheim Y, et al. A large nucleolar U3 ribonucleoprotein required for 18S ribosomal RNA biogenesis. Nature. 2002;417:967–970. - PMC - PubMed
    1. Ferreira-Cerca S, Poll G, Kuhn H, Neueder A, Jakob S, Tschochner H, Milkereit P. Analysis of the in vivo assembly pathway of eukaryotic 40S ribosomal proteins. Mol. Cell. 2007;28:446–457. - PubMed
    1. Fromont-Racine M, Senger B, Saveanu C, Fasiolo F. Ribosome assembly in eukaryotes. Gene. 2003;313:17–42. - PubMed
    1. Tschochner H, Hurt E. Pre-ribosomes on the road from the nucleolus to the cytoplasm. Trends Cell Biol. 2003;13:255–263. - PubMed
    1. Henras AK, Soudet J, Gerus M, Lebaron S, Caizergues-Ferrer M, Mougin A, Henry Y. The post-transcriptional steps of eukaryotic ribosome biogenesis. Cell Mol. Life Sci. 2008 doi: 10.1007/s00018-008-8027-0. - PMC - PubMed

Publication types

MeSH terms

Substances