. 2008 Oct;7(10):1649-60.
doi: 10.1128/EC.00233-08. Epub 2008 Jul 25.

Dispersed mutations in histone H3 that affect transcriptional repression and chromatin structure of the CHA1 promoter in Saccharomyces cerevisiae

Affiliations

Dispersed mutations in histone H3 that affect transcriptional repression and chromatin structure of the CHA1 promoter in Saccharomyces cerevisiae

Qiye He et al. Eukaryot Cell. 2008 Oct.

Abstract

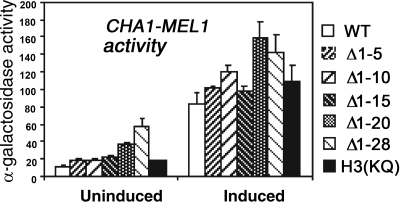
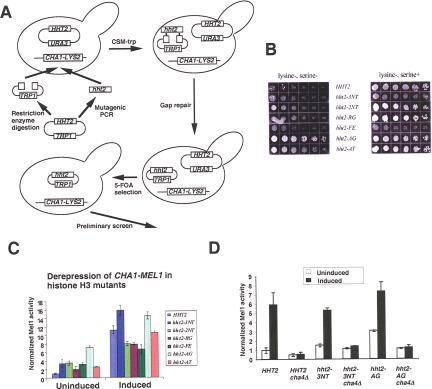
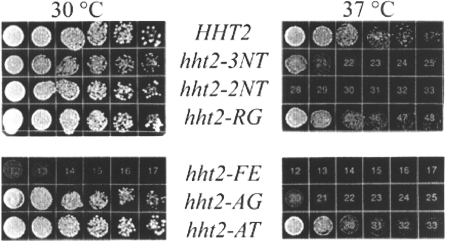
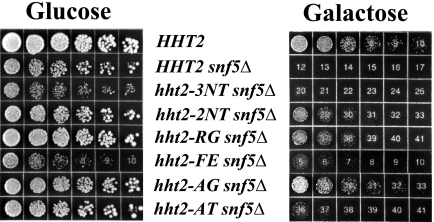
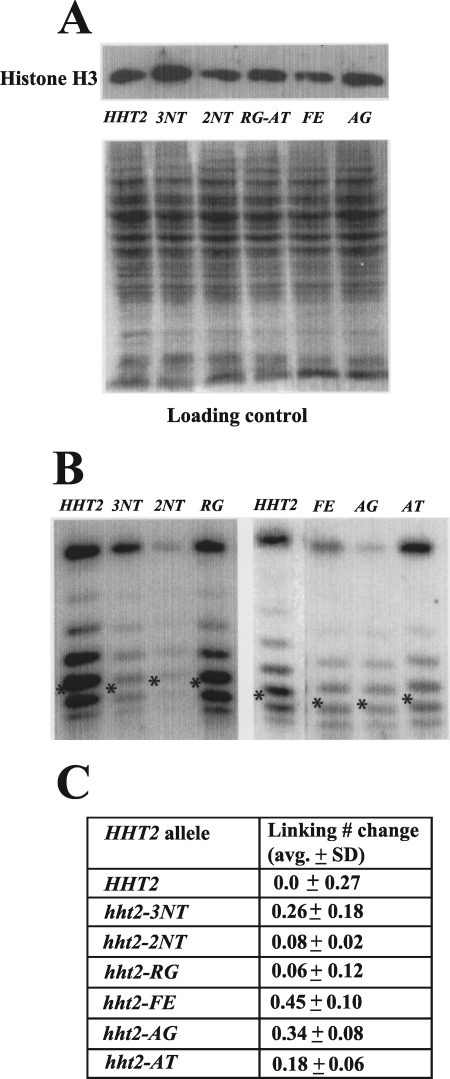
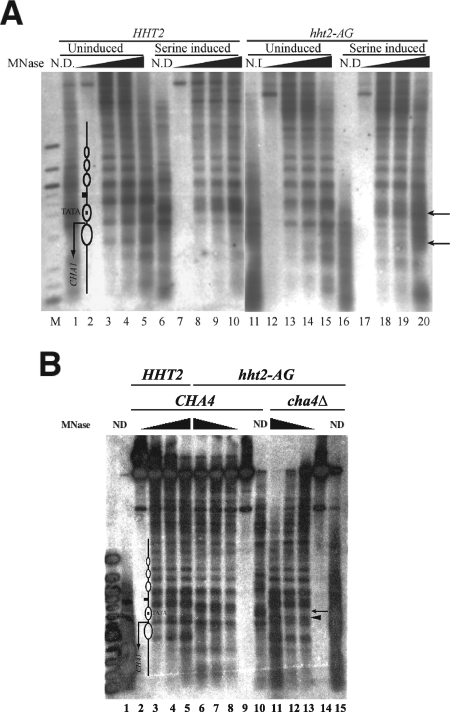
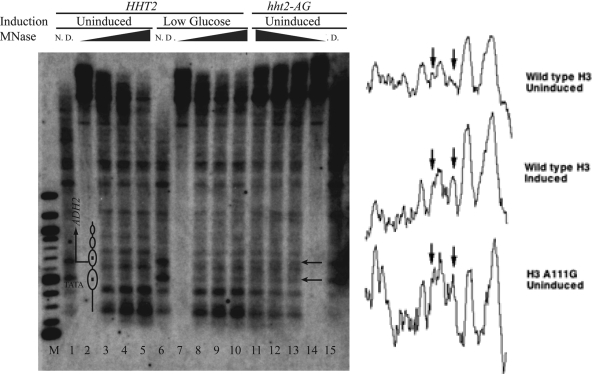
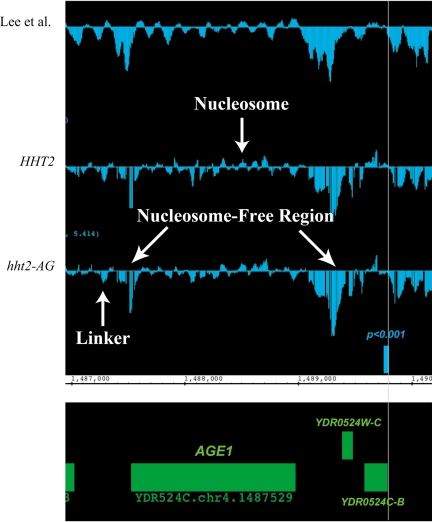
The histone H3 amino terminus, but not that of H4, is required to prevent the constitutively bound activator Cha4 from remodeling chromatin and activating transcription at the CHA1 gene in Saccharomyces cerevisiae. Here we show that neither the modifiable lysine residues nor any specific region of the H3 tail is required for repression of CHA1. We then screened for histone H3 mutations that cause derepression of the uninduced CHA1 promoter and identified six mutants, three of which are also temperature-sensitive mutants and four of which exhibit a sin(-) phenotype. Histone mutant levels were similar to that of wild-type H3, and the mutations did not cause gross alterations in nucleosome structure. One specific and strongly derepressing mutation, H3 A111G, was examined in depth and found to cause a constitutively active chromatin configuration at the uninduced CHA1 promoter as well as at the ADH2 promoter. Transcriptional derepression and altered chromatin structure of the CHA1 promoter depend on the activator Cha4. These results indicate that modest perturbations in distinct regions of the nucleosome can substantially affect the repressive function of chromatin, allowing activation in the absence of a normal inducing signal (at CHA1) or of Swi/Snf (resulting in a sin(-) phenotype).


Figures

FIG. 1.
FIG. 1.
The repressive effect of the H3 amino terminus is dispersed and independent of the lysine residues. Yeast strains harboring wild-type histone H3 (CY1-4C) or H3 mutants having successive truncations of the amino terminus, as indicated (CY2-, CY3-, CY4-, CY5-, and CY6-4C), or having lysines mutated to glutamines (CY7-4C) were transformed with the reporter gene plasmid pBM150CHA1MEL1. Three independent transformants of each strain were grown in complete synthetic medium lacking uracil and leucine (CMS−Ura−Leu), with or without 1 mg/ml serine, and Mel1 activity was measured. Standard deviations (SD) are indicated with error bars.
FIG. 2.
FIG. 2.
Identification of histone H3 mutants that derepress the uninduced CHA1 promoter. (A) Schematic of screen. (B) Growth of the parent strain (RMY321) and mutants (RMY322 to -327) on CSM−Lys±Ser. Cells were serially diluted threefold and were grown at 30°C for 72 h. (C) H3 mutant strains and the corresponding wild-type strain (RMY331 to -337) were grown in CSM−Ura−Trp, with or without 1 mg/ml serine, and the activity of the CHA1-MEL1 reporter gene was measured. Mel1 activities were normalized to that of the uninduced wild-type strain, and the SD is indicated for each (n = 3). (D) Cha4 is required for derepression of the CHA1 promoter in hht2-3NT and hht2-AG mutant yeast. Mel1 activities were normalized to that of the uninduced wild-type strain, and the SD is indicated for each (n = 3).
FIG. 3.
FIG. 3.
Temperature sensitivity of histone mutants. Cells from wild-type and H3 mutant (RMY331 to -337) strains were serially diluted threefold and were grown on yeast extract-peptone-dextrose at 30°C for 48 h or at 37°C for 72 h.
FIG. 4.
FIG. 4.
sin phenotypes of histone H3 mutants. Strains expressing wild-type histone H3 or histone H3 mutants and deleted for the SNF5 gene (RMY351 to -357) were serially diluted threefold and grown on glucose- or galactose-only medium at 30°C for 72 h. The control SNF5+ strain was RMY301.
FIG. 5.
FIG. 5.
Histone H3 mutations do not grossly affect protein level or nucleosome structure. (A) Histone mutants are expressed at levels similar to that of wild-type histone H3. Cell lysates from yeast strains harboring wild-type histone H3 (RMY331) or the indicated mutants (RMY332, RMY333, RMY335, RMY336, and RMY338) were electrophoresed in a 10% polyacrylamide gel, subjected to Western blotting, and visualized using an antibody against the C terminus of histone H3. The loading control was done by staining the SDS-PAGE gel after protein transfer. (B) Histone mutations cause little change in minichromosome topology. Genomic DNAs from strains harboring URA3-ARS1 and expressing wild-type histone H3 (RMY341) or the indicated H3 mutants (RMY342 to -347) were extracted using glass beads. DNA samples were run in a 1.5% agarose gel containing 40 μg/ml chloroquine; following Southern blotting, the minichromosomes were visualized using a probe corresponding to the URA3 coding sequence. Asterisks indicate the center of the Gaussian distribution of topoisomers. The band at the top of each lane is nicked circular URA3-ARS1 plasmid, and faster-migrating topoisomers represent more positively supercoiled species. (C) Linking number change (toward more positively supercoiled values) of the URA3-ARS1 minichromosome in yeast harboring the indicated histone H3 mutants relative to that in the wild type. Averages and SD were determined using at least three independent clones.
FIG. 6.
FIG. 6.
Perturbed chromatin structure of the CHA1 promoter in hht2-AG mutant yeast. (A) MNase cleavage sites were mapped for naked DNA and for chromatin from HHT2 (RMY301) and hht2-AG (RMY306) yeast grown in the presence or absence of serine, as indicated. Cleavage sites were mapped relative to the BamHI site 602 bp 3′ of the starting ATG. Chromatin was digested with MNase at 10 units/ml (lanes 3, 8, 13, and 18), 20 units/ml (lanes 4, 9, 12, and 19), and 50 units/ml (lanes 5, 10, 15, and 20); no-MNase controls are in lanes 2, 7, 12, and 17, and lanes 1, 6, 11, and 16 contain naked DNA digested with 2 units/ml MNase. Lane M contains 100-bp-ladder marker DNA (NEB). The upper arrow indicates a cleavage close to the TATA element that is protected in the inactive promoter, and the lower arrow indicates a cleavage between two positioned nucleosomes present in the inactive gene that is lost following nucleosome rearrangement in the active gene. The diagram in lane 2 shows the locations of nucleosomes in the inactive promoter and the TATA element; the small square between nucleosomes and upstream of the TATA element represents the CHA1 upstream activating sequence. (B) MNase cleavage sites were mapped from the BamHI site from chromatin prepared from HHT2 (RMY301) (lanes 2 to 5), hht2-AG (RMY306) (lanes 6 to 9), and cha4Δ::KanMX hht2-AG (RMY356) (lanes 11 to 14) yeast grown in the absence of serine. The leftmost lane contains a 100-bp marker (NEB). Samples were digested with MNase at 10 units/ml (lanes 3, 8, and 13), 20 units/ml (lanes 4, 7, and 12), and 50 units/ml (lanes 5, 6, and 11); lanes 2, 9, and 14 are no-MNase controls, and lanes 1, 10, and 15 contain naked DNA digested with 2 units/ml MNase. The structure of the uninduced promoter region is indicated on the left, with the ovals representing positioned nucleosomes. The arrowhead next to lane 12 indicates a cleavage site that is reproducibly cut more prominently in uninduced cha4Δ hht2-AG yeast than in uninduced HHT2 yeast, and the arrow above indicates a cleavage site in the region of the TATA element that is cleaved in hht2-AG yeast when Cha4 is present but not in cha4Δ hht2-AG yeast.
FIG. 7.
FIG. 7.
Perturbed chromatin structure of the ADH2 promoter in hht2-AG yeast. MNase cleavage sites were mapped for naked DNA and for chromatin from HHT2 (RMY301) and hht2-AG (RMY306) yeast in the presence of 2% glucose (uninduced) and 0.05% glucose (low glucose), as indicated, for 2.75 h. Cleavage sites were mapped relative to the SacI site 656 bp 5′ of the starting ATG. Samples were digested with MNase at 10 units/ml (lanes 3, 8, and 13), 20 units/ml (lanes 4, 9, and 12), and 50 units/ml (lanes 5, 10, and 11); lanes 2, 7, and 14 are no-MNase controls, and lanes 1, 6, and 15 contain naked DNA digested with 2 units/ml MNase. Lane M contains 100-bp-ladder marker DNA. The arrows indicate a cleavage site close to the TATA element and a cleavage site close to the starting ATG site that are cleaved more strongly in induced wild-type or uninduced hht2-AG yeast than in the uninduced wild-type yeast. The diagram in lane 2 indicates the positions of nucleosomes in the uninduced promoter and the TATA element. To the right are densitometric scans of portions of lanes 3 (upper), 8 (middle), and 13 (lower), between 200 and 1,000 bp. The left and right arrows correspond to the upper and lower arrows next to lane 14, respectively. Note the peak indicated by the right arrows in the lower two scans and essentially absent from the upper scan and the stronger intensities of surrounding peaks, indicated by the left arrows, in the lower two scans than in the upper scan.
FIG. 8.
FIG. 8.
Nucleosome occupancy measured by high-density tiling arrays over a region of yeast chromosome IV. The upper trace indicates nucleosome occupancy (measured as the log2 of the intensity of mononucleosomal DNA compared to that of a genomic DNA control), measured by Lee et al. (16), and the traces below show nucleosome occupancy in wild-type yeast (RMY301) and hht2-AG yeast (RMY306), as indicated, from the present study. Chromosomal coordinates are indicated, and the green rectangles represent known ORFs, as indicated. The small blue rectangle labeled “P < 0.001” is a region at which nucleosome occupancy differs between the wild type and the hht2-AG mutant, as can be seen from the individual traces (vertical line). Examples of a well-positioned nucleosome, nucleosome-free regions, and a linker region are indicated. The small gaps visible in the profiles from the current study are a processing artifact (see Materials and Methods).
FIG. 9.
FIG. 9.
Structural features of histone H3 mutants. (A) Locations of R69 and E105 on the surface of the nucleosome core. R69 (red) forms direct contact with nucleosomal DNA (cyan), while E105 (red) does not. F104 and A111 are buried in the histone fold domain and thus are invisible. Yellow and blue, histone H3 proteins that have the labeled R69 and E105 residues, respectively; green, the other core histone proteins. (B) Closeup of the R69-DNA interaction and effect of R69G mutation. (C) Closeup of the region around A111 and replacement with glycine or threonine. (D) Closeup of the region around F104 and E105 and the F104S E105G (hht2-FE) mutation.

References

    1. Almer, A., H. Rudolph, A. Hinnen, and W. Horz. 1986. Removal of positioned nucleosomes from the yeast PHO5 promoter upon PHO5 induction releases additional upstream activating DNA elements. EMBO J. 52689-2696. - PMC - PubMed
    1. Berger, S. L. 2007. The complex language of chromatin regulation during transcription. Nature 447407-412. - PubMed
    1. Christianson, T. W., R. S. Sikorski, M. Dante, J. H. Shero, and P. Hieter. 1992. Multifunctional yeast high-copy-number shuttle vectors. Gene 110119-122. - PubMed
    1. Cosgrove, M. S., J. D. Boeke, and C. Wolberger. 2004. Regulated nucleosome mobility and the histone code. Nat. Struct. Mol. Biol. 111037-1043. - PubMed
    1. Duina, A. A., and F. Winston. 2004. Analysis of a mutant histone H3 that perturbs the association of Swi/Snf with chromatin. Mol. Cell. Biol. 24561-572. - PMC - PubMed

Publication types

MeSH terms

Associated data