Changes in the structure-function relationship of elastin and its impact on the proximal pulmonary arterial mechanics of hypertensive calves
- PMID: 18660454
- PMCID: PMC2593497
- DOI: 10.1152/ajpheart.00127.2008
Changes in the structure-function relationship of elastin and its impact on the proximal pulmonary arterial mechanics of hypertensive calves
Abstract
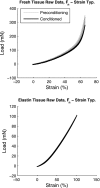
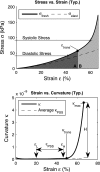
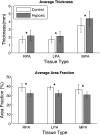
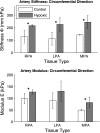
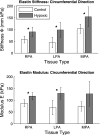
Extracellular matrix remodeling has been proposed as one mechanism by which proximal pulmonary arteries stiffen during pulmonary arterial hypertension (PAH). Although some attention has been paid to the role of collagen and metallomatrix proteins in affecting vascular stiffness, much less work has been performed on changes in elastin structure-function relationships in PAH. Such work is warranted, given the importance of elastin as the structural protein primarily responsible for the passive elastic behavior of these conduit arteries. Here, we study structure-function relationships of fresh arterial tissue and purified arterial elastin from the main, left, and right pulmonary artery branches of normotensive and hypoxia-induced pulmonary hypertensive neonatal calves. PAH resulted in an average 81 and 72% increase in stiffness of fresh and digested tissue, respectively. Increase in stiffness appears most attributable to elevated elastic modulus, which increased 46 and 65%, respectively, for fresh and digested tissue. Comparison between fresh and digested tissues shows that, at 35% strain, a minimum of 48% of the arterial load is carried by elastin, and a minimum of 43% of the change in stiffness of arterial tissue is due to the change in elastin stiffness. Analysis of the stress-strain behavior revealed that PAH causes an increase in the strains associated with the physiological pressure range but had no effect on the strain of transition from elastin-dominant to collagen-dominant behavior. These results indicate that mechanobiological adaptations of the continuum and geometric properties of elastin, in response to PAH, significantly elevate the circumferential stiffness of proximal pulmonary arterial tissue.
Figures




References
-
- Aaron BB, Gosline JM. Elastin as a random-network elastomer–a mechanical and optical analysis of single elastin fibers. Biopolymers 20: 1247–1260, 1981.
-
- Arribas SM, Hinek A, Gonzalez MC. Elastic fibres and vascular structure in hypertension. Pharmacol Ther 111: 771–791, 2006. - PubMed
-
- Bezie Y, Lacolley P, Laurent S, Gabella G. Connection of smooth muscle cells to elastic lamellae in aorta of spontaneously hypertensive rats. Hypertension 32: 166–169, 1998. - PubMed
-
- Bezie Y, Lamaziere JMD, Laurent S, Challande P, Cunha RS, Bonnet J, Lacolley P. Fibronectin expression and aortic wall elastic modulus in spontaneously hypertensive rats. Arterioscler Thromb Vasc Biol 18: 1027–1034, 1998. - PubMed
-
- Blacher J, Guerin AP, Pannier B, Marchais SJ, Safar ME, London GM. Impact of aortic stiffness on survival in end-stage renal disease. Circulation 99: 2434–2439, 1999. - PubMed
Publication types
MeSH terms
Substances
Grants and funding
LinkOut - more resources
Full Text Sources
Medical

