. 2008 Dec;35(12):2275-85.
doi: 10.1007/s00259-008-0870-6. Epub 2008 Jul 26.

Uptake kinetics and biodistribution of 14C-D-luciferin--a radiolabeled substrate for the firefly luciferase catalyzed bioluminescence reaction: impact on bioluminescence based reporter gene imaging

Affiliations

Uptake kinetics and biodistribution of 14C-D-luciferin--a radiolabeled substrate for the firefly luciferase catalyzed bioluminescence reaction: impact on bioluminescence based reporter gene imaging

Frank Berger et al. Eur J Nucl Med Mol Imaging. 2008 Dec.

Abstract

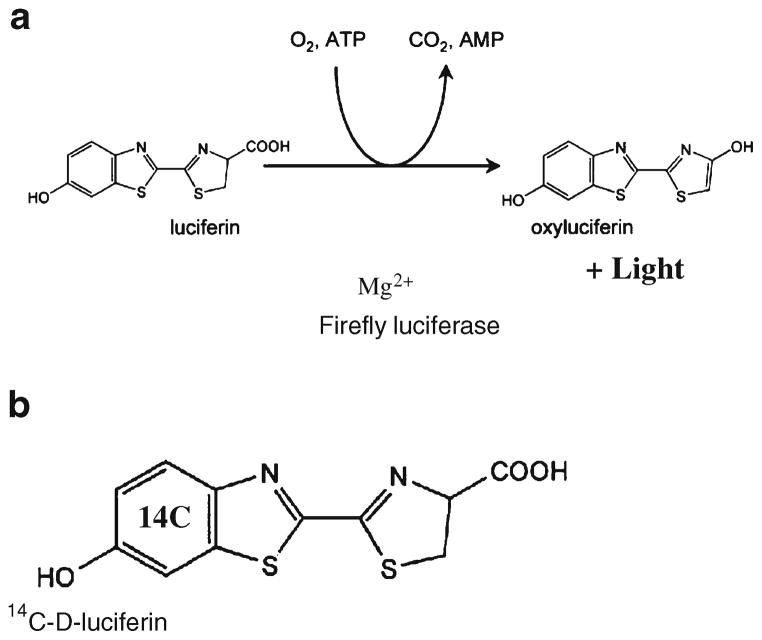
Purpose: Firefly luciferase catalyzes the oxidative decarboxylation of D: -luciferin to oxyluciferin in the presence of cofactors, producing bioluminescence. This reaction is used in optical bioluminescence-based molecular imaging approaches to detect the expression of the firefly luciferase reporter gene. Biokinetics and distribution of the substrate most likely have a significant impact on levels of light signal and therefore need to be investigated.

Methods: Benzene ring (14)C(U)-labeled D-luciferin was utilized. Cell uptake and efflux assays, murine biodistribution, autoradiography and CCD-camera based optical bioluminescence imaging were carried out to examine the in vitro and in vivo characteristics of the tracer in cell culture and in living mice respectively.

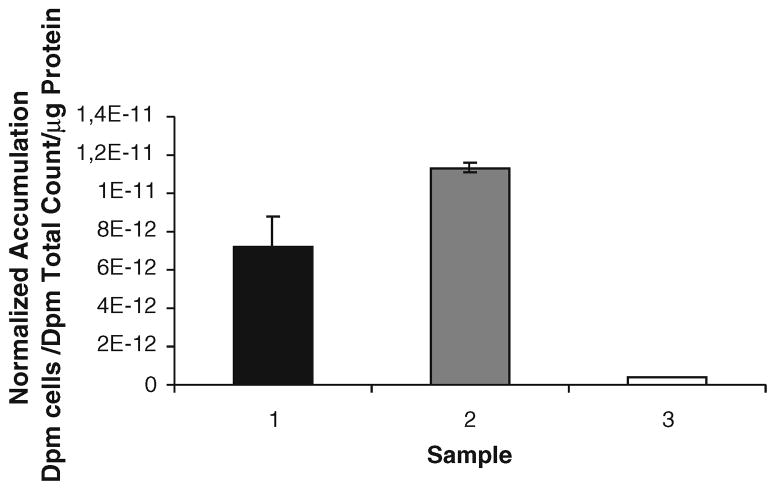
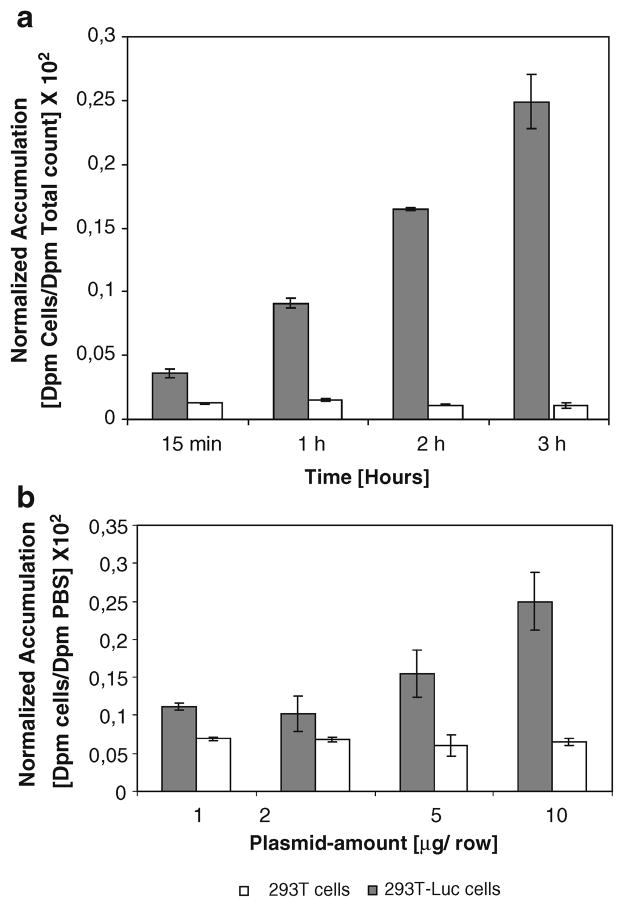
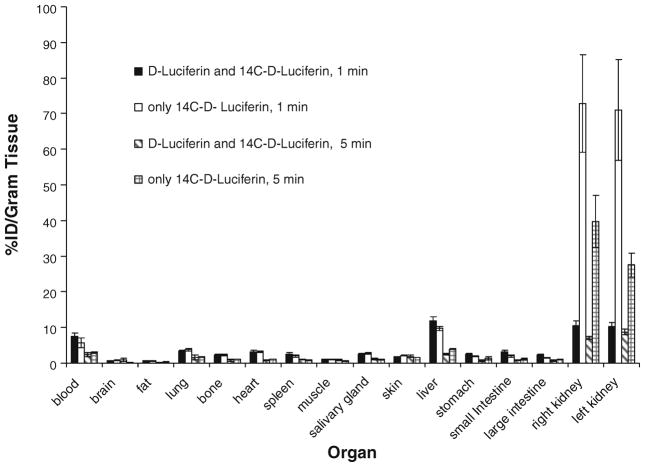
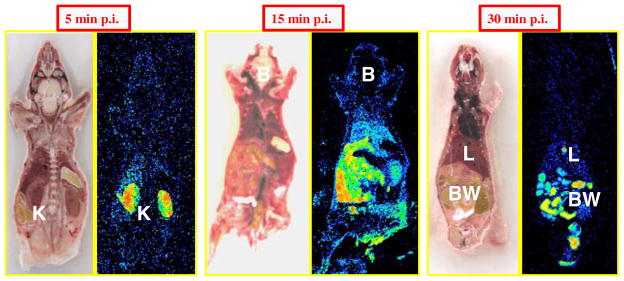
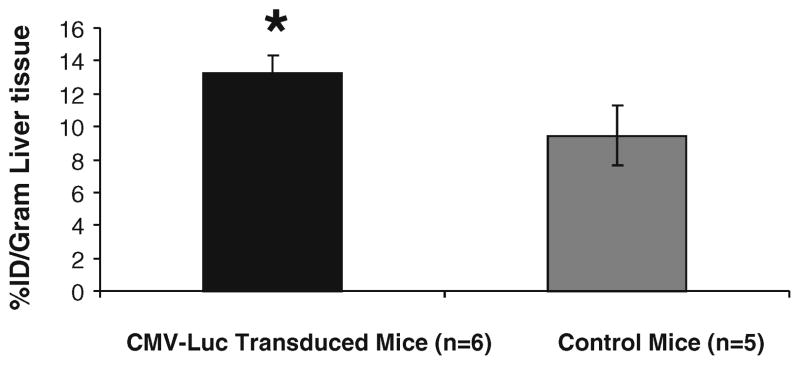
Results: Radiolabeled and unlabeled D-luciferin revealed comparable levels of light emission when incubated with equivalent amounts of the firefly luciferase enzyme. Cell uptake assays in pCMV-luciferase-transfected cells showed slow trapping of the tracer and relatively low uptake values (up to 22.9-fold higher in firefly luciferase gene-transfected vs. nontransfected cells, p = 0.0002). Biodistribution studies in living mice after tail-vein injection of (14)C-D-luciferin demonstrated inhomogeneous tracer distribution with early predominant high radioactivity levels in kidneys (10.6% injected dose [ID]/g) and liver (11.9% ID/g), followed at later time points by the bladder (up to 81.3% ID/g) and small intestine (6.5% ID/g), reflecting the elimination routes of the tracer. Kinetics and uptake levels profoundly differed when using alternate injection routes (intravenous versus intraperitoneal). No clear trapping of (14)C-D-luciferin in firefly luciferase-expressing tissues could be observed in vivo.

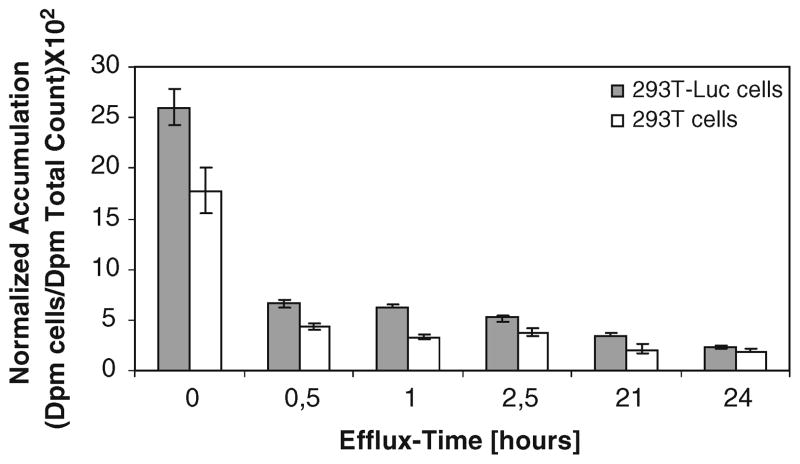
Conclusions: The data obtained with (14)C-D-luciferin provide insights into the dynamics of D: -luciferin cell uptake, intracellular accumulation, and efflux. Results of the biodistribution and autoradiographic studies should be useful for optimizing and adapting optical imaging protocols to specific experimental settings when utilizing the firefly luciferase and D: -luciferin system.


Conflict of interest statement

Conflict of interest statement All authors state that they have no conflict of interests.

Figures

Fig. 1
Fig. 1
a Firefly Luciferase catalyzes the oxidative decarboxylation of Luciferin in the presence of ATP, O2, and Mg2+, producing yellow-green light (λmax=560 nm). b Chemical structure of D-luciferin, [benzene ring–14C (U)]–: Approximately one carbon atom of the benzene ring in this radiotracer is randomly replaced by 14C. The functionality of 14C-D-luciferin was preserved in all our tests
Fig. 2
Fig. 2
a To a buffer solution with rising amounts of FL concentration and fixed amounts of ATP and MgSO4, fixed amounts of 14C-D-luciferin or D-luciferin were added, and the bioluminescence signal was measured. Light signal was detected by the luminometer from an amount of 8 ng FL on. The detected amount of light signal is displayed on the y-axis and given in relative light units (RLU) per minute. There were no significant differences in the measured light yields when using 14C-D-luciferin in comparison to unlabeled luciferin (p=0.36). b To test the functionality of 14C-D-luciferin in cell culture, 293T cells expressing FL and native cells were investigated. After adding corresponding amounts of unlabeled or 14C-labeled D-luciferin to the wells, light emission was measured in a CCD camera. Up to 173 min after adding the substrate to the FL-expressing 293T cells, we found slightly lower light levels (p=0.02) in wells with labeled D-luciferin, at time point 720 min, no significant differences were observed (p=0.2)
Fig. 3
Fig. 3
293T CMV-Luc cells were exposed for 15 min with 14C-D-luciferin, followed by cell uptake measurements for 14C-derived radioactivity. The cell uptake of 14C-D-luciferin is 1.6 fold higher (p=0.04) in the presence of mass amounts of unlabeled D-luciferin during the uptake period. Sample 1: 293T-CMV-Luc cells, +14C-D-luciferin. Sample 2: 293T-CMV-Luc cells, +14C- D-luciferin+mass amounts of carrier D-luciferin. Sample 3: No radioactivity added (background control with 293T-CMV-Luc cells)
Fig. 4
Fig. 4
a 293T cells transiently transfected with CMV-Luc show significant (p=0.0002) higher uptake levels in comparison to native 293T cells, when exposed to PBS containing 14C-D-luciferin. The transfected cells show highest uptake values (up to 22.9-fold higher in fluc transfected vs. nontransfected cells) after a 3-h exposure with PBS containing the radiotracer. b 293T cells transiently transfected with different amount of CMV-Luc plasmid show highest intracellular uptake levels of 14C-D-luciferin after transfection with 10 μg per fluc plasmid per row. Cell uptake time was 1 h
Fig. 5
Fig. 5
293T CMV-Luc cells and native 293T cells were incubated for 1 h with 14C-D-luciferin containing cell media and FBS. Then, the radioactivity efflux from the cells was measured. Most of the efflux takes place in the first 30 min
Fig. 6
Fig. 6
a Biodistribution of 14C-D-luciferin in nude mice without fluc expression after tail-vein injection of 18.5 kBq 14C-D-luciferin and 3 mg carrier D-luciferin. Note the early high uptake values in the kidneys due to fast renal excretion of the tracer; 15 min after injection, significant uptake in most of the organs is demonstrated with low uptake in the brain. Blood levels and liver activity, which equals blood pool at early time points, peak early but fall rapidly. b Biodistribution of 14C-D-luciferin in nude mice without fluc expression after intraperitoneal injection with the same amounts of tracer and carrier like above. Note the differences in biodistribution after intraperitoneal injection in comparison to intravenous injection: Blood levels rise less high but are longer detectable. Kidney activity peaks later. In general, organ activity is not getting as high as after intravenous injection. Bowel/intestine activities are at early time points high probably due to the injection route
Fig. 7
Fig. 7
Differences of the biodistribution patterns were evaluated in nude mice not expressing FL which were intravenously injected with only labeled 14C-D-luciferin or mass levels of carrier added to the 14C-D-luciferin (18.5 kBq 14C-D-luciferin and 3 mg D-luciferin). The results were evaluated 1 and 5 min after injection of the tracer. Kidney activities are significantly higher, if only 14C-D-luciferin is injected, but other organ activities do not differ significantly with our without coinjection of mass levels of carrier substrate
Fig. 8
Fig. 8
Autoradiograms (N=6 mice) 5, 15, and 30 min after coinjection via the tail vein of 18.5 kBq 14C-D-luciferin and 3 mg carrier D-luciferin. Autoradiographic studies verified results from the biodistribution experiments with early high uptake values in the kidney followed by accumulation in the gut system (K kidney, B brain, L liver, BW bowel)
Fig. 9
Fig. 9
Mice were transduced by injecting Ad-CMV-luciferase via the tail vein; the control mice were injected with a control virus without the fluc sequence. Five minutes after tail-vein injection of 14C-D-luciferin and mass level of carrier D-luciferin, mice were imaged in a CCD camera, and organs were harvested immediately after imaging to measure uptake in %ID/g. In pooled data over six fluc-transfected and five control mice, the difference in 14C-D-luciferin uptake was only borderline significant (p=0.0047). No higher uptake differences between fluc-transfected and control tissue could be detected at earlier or later time points in similar experiments

References

    1. Contag CH, Ross BD. It’s not just about anatomy: in vivo bioluminescence imaging as an eyepiece into biology. J Magn Reson Imaging. 2002;16:378–87. - PubMed
    1. Massoud TF, Gambhir SS. Molecular imaging in living subjects: seeing fundamental biological processes in a new light. Genes Dev. 2003;17(5):545–80. - PubMed
    1. Iyer M, Sato M, Johnson M, Gambhir SS, Wu L. Applications of molecular imaging in cancer gene therapy. Curr Gene Ther. 2005;5 (6):607–18. - PubMed
    1. Bhaumik S, Gambhir SS. Optical imaging of Renilla luciferase reporter gene expression in living mice. Proc Natl Acad Sci USA. 2002;99(1):377–82. - PMC - PubMed
    1. Tannous BA, Kim DE, Fernandez JL, Weissleder R, Breakefield XO. Codon-optimized Gaussia luciferase cDNA for mammalian gene expression in culture and in vivo. Mol Ther. 2005;11(3):435–43. - PubMed

Publication types

MeSH terms