. 2009 May;30(5):1637-51.
doi: 10.1002/hbm.20630.

Defining the face processing network: optimization of the functional localizer in fMRI

Affiliations

Defining the face processing network: optimization of the functional localizer in fMRI

Christopher J Fox et al. Hum Brain Mapp. 2009 May.

Abstract

Functional localizers that contrast brain signal when viewing faces versus objects are commonly used in functional magnetic resonance imaging studies of face processing. However, current protocols do not reliably show all regions of the core system for face processing in all subjects when conservative statistical thresholds are used, which is problematic in the study of single subjects. Furthermore, arbitrary variations in the applied thresholds are associated with inconsistent estimates of the size of face-selective regions-of-interest (ROIs). We hypothesized that the use of more natural dynamic facial images in localizers might increase the likelihood of identifying face-selective ROIs in individual subjects, and we also investigated the use of a method to derive the statistically optimal ROI cluster size independent of thresholds. We found that dynamic facial stimuli were more effective than static stimuli, identifying 98% (versus 72% for static) of ROIs in the core face processing system and 69% (versus 39% for static) of ROIs in the extended face processing system. We then determined for each core face processing ROI, the cluster size associated with maximum statistical face-selectivity, which on average was approximately 50 mm(3) for the fusiform face area, the occipital face area, and the posterior superior temporal sulcus. We suggest that the combination of (a) more robust face-related activity induced by a dynamic face localizer and (b) a cluster-size determination based on maximum face-selectivity increases both the sensitivity and the specificity of the characterization of face-related ROIs in individual subjects.


Figures

Figure 1
Figure 1
Representative fMRI images for regions comprising the core system of face perception: occipital face area (OFA); fusiform face area (FFA); posterior superior temporal sulcus (pSTS). Overlay maps of the face > object contrast are set at the threshold of P < 0.05 (1‐tailed Bonferroni). Results from the static localizer are overlaid in blue and the results of the dynamic localizer in orange–yellow. Clear overlaps in all regions can be seen, with more widespread activity readily apparent in the dynamic localizer maps. [Color figure can be viewed in the online issue, which is available at www.interscience.wiley.com.]
Figure 2
Figure 2
Representative fMRI images for regions comprising the extended system of face perception. Top left: bilateral middle superior temporal sulcus (mSTS). Top right: bilateral Amygdala (AMG). Bottom Left: bilateral inferior frontal gyrus (IFG). Bottom right: precuneus (preC; red arrow) and anterior paracingulate cortex (aPC; white arrow). Because of the poor localization of these regions using the static localizer, overlaid maps are results from the statistical analysis of the dynamic localizer (faces > objects; P < 0.05, 1‐tailed Bonferroni). [Color figure can be viewed in the online issue, which is available at www.interscience.wiley.com.]
Figure 3
Figure 3
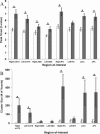
Results from the statistical comparison of the static (white bars) and dynamic localizers (gray bars) (Mean ± SEM). A: When using the dynamic localizer significantly higher t‐values are seen in the peak voxel of all regions in the core system (indicated with an asterisk), with the largest effects observed in the pSTS. B: Use of the dynamic localizer results in the localization of significantly larger clusters of face‐related activity within the left‐OFA, right‐FFA, and bilateral‐pSTS (indicated with an asterisk), with a similar but nonsignificant pattern observed in other regions of the core system.
Figure 4
Figure 4
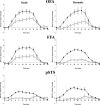
Response time courses for faces (filled circles) and objects (open circles) within the right OFA (top), right FFA (middle), and right pSTS (bottom). Time courses were extracted from the individually localized ROIs and averaged (Mean ± SEM). Responses from the static localizer are presented in the left column, and the dynamic localizer in the right column. The dynamic localizer increases the separation of signal between faces and objects in all three of these core face processing regions.
Figure 5
Figure 5
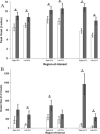
Results from the statistical comparison of the static (white bars) and dynamic localizers (gray bars) (Mean ± SEM). A: When using the dynamic localizer significantly higher t‐values are seen in the peak voxel of all regions in the extended system (indicated with an asterisk), excluding the left‐IFG, which shows a trend in the same direction. B: Use of the dynamic localizer results in the localization of significantly larger clusters of face‐related activity within the bilateral mSTS, right‐IFG, preC, and aPC (indicated with an asterisk).
Figure 6
Figure 6
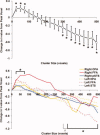
Face‐selectivity as a function of cluster size (Mean ± SEM; significant values marked with an asterisk and trends with a pound sign). A: Averaged results from all six ROIs (bilateral OFA, FFA, and pSTS). Clusters between 25 and 75 voxels show significantly increased face‐selectivity with respect to their respective peak voxel. Clusters of > 325 voxels show significantly decreased face‐selectivity. B: To illustrate the common effect within all six ROIs, individual curves are plotted. A slight broadening of the right‐FFA peak of face‐selectivity can be observed (solid red line). [Color figure can be viewed in the online issue, which is available at www.interscience.wiley.com.]
Figure 7
Figure 7
A: Average cluster size at which maximal face‐selectivity is observed (∼50 voxels). A GLM indicates no difference between the average cluster size of all six ROIs (bilateral OFA, FFA, and pSTS). All cluster sizes are significantly larger than the peak voxel alone (indicated with an asterisk). B: A frequency plot of the cluster size at which maximal face‐selectivity is observed reveals the majority of ROIs reaching maximal face selectivity by a cluster size of 75 voxels, with very few requiring clusters of greater than 200 voxels to achieve maximal face‐selectivity.
Figure 8
Figure 8
Face‐selectivity comparison of ROIs localized with three different methods (Mean t‐value ± SEM). Using a fixed statistical threshold is the least effective method of localizing face‐selective ROIs. The use of a fixed cluster size localizes ROI which are more face‐selective, but the use of individually based statistics to determine optimal cluster size is the most effective way of ensuring the localization of face‐selective ROIs. All differences are significant (P < 0.001). The solid bar indicates average face‐selectivity of the peak voxel alone. Individually determined cluster size and fixed cluster size methods result in ROIs with face‐selectivity greater than the peak voxel alone, whereas a fixed statistical threshold results in ROIs with reduced face‐selectivity with respect to the peak voxel.

References

    1. Adolphs R,Tranel D,Damasio H,Damasio A ( 1994): Impaired recognition of emotion in facial expressions following bilateral damage to the human amygdala. Nature 372: 669–672. - PubMed
    1. Adolphs R,Damasio H,Tranel D,Damasio AR ( 1996): Cortical systems for the recognition of emotion in facial expressions. J Neurosci 16: 7678–7687. - PMC - PubMed
    1. Andrews TJ,Ewbank MP ( 2004): Distinct representations for facial identity and changeable aspects of faces in the human temporal lobe. Neuroimage 23: 905–913. - PubMed
    1. Avidan G,Hasson U,Malach R,Behrmann M ( 2005): Detailed exploration of face‐related processing in congenital prosopagnosia, Part 2: Functional neuroimaging findings. J Cogn Neurosci 17: 1150–1167. - PubMed
    1. Barton JJ ( 2003): Disorders of face perception and recognition. Neurol Clin 21: 521–548. - PubMed

Publication types