. 2008 Oct;244(1-2):35-44.
doi: 10.1016/j.heares.2008.07.001. Epub 2008 Jul 12.

Auditory response properties of neurons in the tectal longitudinal column of the rat

Affiliations

Auditory response properties of neurons in the tectal longitudinal column of the rat

Allen F Marshall et al. Hear Res. 2008 Oct.

Abstract

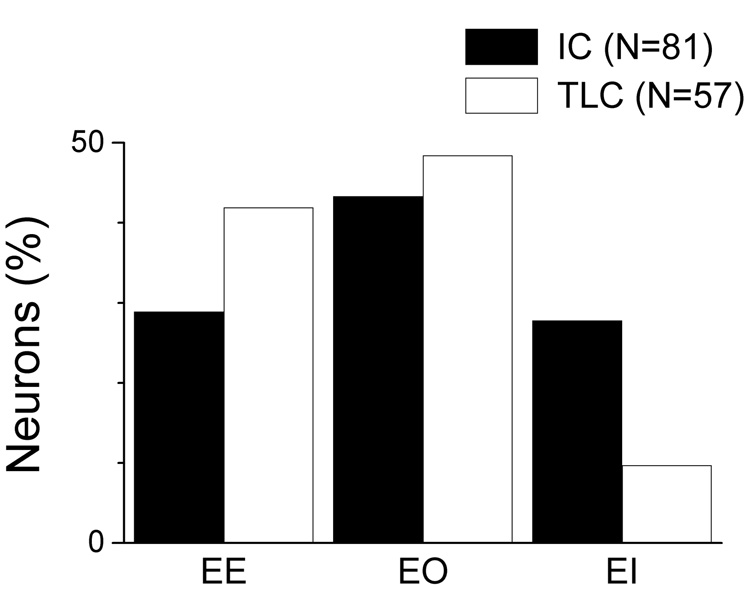
The newly-discovered tectal longitudinal column (TLC) spans the paramedian region of the mammalian tectum. It has connections with several nuclei of the auditory system. In this report, we provide the first detailed description of the responses of TLC neurons to auditory stimuli, including monaural and binaural tones and amplitude modulated tones. For comparison, responses in the inferior colliculus (IC) were also recorded. Neurons in the TLC were sensitive to similar ranges of frequency as IC neurons, could have comparably low thresholds, and showed primarily excitatory responses to stimulation of the contralateral ear with either phasic or sustained response patterns. Differences of TLC compared to IC neurons included broader frequency tuning, higher average threshold, longer response latencies, little synchronization or rate tuning to amplitude modulation frequency and a smaller degree of inhibition evoked by stimulation of the ipsilateral ear. These features of TLC neurons suggest a role for the TLC in descending auditory pathways.


Figures

Figure 1
Figure 1. Coronal sections of rat midbrain
A. Nissl stain (cresyl violet). Cell bodies of the TLC are near the midline, medial and ventral to the superior colliculus and dorsal to the periaqueductal gray. B. Retrograde labeling in the TLC following an injection of FluoroGold into the superior olivary complex. The FluoroGold was rendered permanently visible by immunocytochemistry using a rabbit anti-FluoroGold primary antiserum (see Saldaña et al., 2007 for details). C. Nissl stain showing an electrode track from a TLC recording (between arrows) and a lesion placed in the DC as the electrode was withdrawn (arrowhead). Scale in C = 0.5 mm.
Figure 2
Figure 2
Representative threshold tuning curves to contralateral tones for neurons located in the IC (A) and the TLC (B). The neurons in the IC were from a single penetration and show a clear tonotopy as the electrode moved dorsally from neurons a–e. The neurons from the TLC are from different cases.
Figure 3
Figure 3. No evidence of tonotopy in the TLC
A and B. Examples from two individual cases where neurons with widely different frequency tuning were found in close proximity. In A, neuron a was 120 µm deep to neuron b in the same penetration, and neuron c was from a different penetration 250 µm anterior. In B, all three neurons were from the same penetration, with neuron b located 130 µm deep to neuron a, and neuron c 250 µm deep to neuron b. C. Distribution of penetrations. Filled circles – penetrations localized to the TLC. Open circles – penetrations localized to the dorsolateral PAG. Boxes – location of the TLC determined anatomically (Saldaña et al., 2007). D. Distribution of BFs in the TLC. There was no trend for BFs to be distributed along the rostrocaudal axis of the TLC.
Figure 4
Figure 4. Comparison of thresholds and frequency tuning widths between the IC and TLC
A. Thresholds at CF for neurons in the IC. The solid line is the behavioral audiogram for rats (Kelly and Masterton, 1977). B. Thresholds at CF for neurons in the TLC. C. A comparison of Q10-dB values for the IC and TLC.
Figure 5
Figure 5. Responses in both the IC and TLC could be categorized as phasic or sustained to a contralateral tone burst at BF
The intensity in each case was 70 dB SPL, and the duration was 75 ms for A–F and 5100 ms for G. PSTs were constructed from 30 repetitions and a 1 ms bin width, except for G which had 2 repetitions and a 30 ms bin width. A. A phasic response from the IC. BF = 2.3 kHz. B. A sustained response from the IC showing little adaptation. BF = 11.3 kHz. C. A sustained response from the IC showing a greater degree of adaptation BF=14.3 kHz. D. A sustained response from an IC neuron that showed chopping near the onset of the stimulus BF=6.7 kHz‥ E. A sustained response from the IC with a long-latency. BF = 6.7 kHz. F. A phasic response from the TLC. BF = 2.4 kHz. G. A sustained response from the TLC. BF = 24 .5 kHz. H. The same neuron as in G, showing a sustained response to a long stimulus duration (5100 ms). I. Distribution of sustained and onset type neurons in the IC and TLC. A higher proportion of TLC neurons had a sustained response.
Figure 6
Figure 6. Distribution of response latencies for IC and TLC neurons
Figure 7
Figure 7. Examples of rate and synchronization modulation transfer functions to SAM tones
The stimulus was 3 repetitions of an 1100 ms-long SAM tone to the contralateral ear at 70 dB SPL with carrier at BF and 100% modulation. A. IC neurons. These neurons were tuned to AM in discharge rate and showed a high degree of synchronization to the modulation frequency. B. TLC neurons. These neurons showed little tuning to AM in rate and had a low degree of synchronization to the modulation frequency. C. The distributions of maximum synchronization for neurons in the IC and TLC. The synchronization values in the TLC were in general lower than in the IC.
Figure 8
Figure 8. Binaural response types in the IC and TLC
Distributions of EI, EO and EE neurons in both nuclei.
Figure 9
Figure 9. Raster plots of responses from a neuron in the dorsolateral PAG as the interstimulus interval was changed
Neurons in the dorsolateral PAG typically required long intervals before they would respond and then yielded a well-time spike at stimulus onset. The stimulus was low-pass noise (cut-off frequency of 16000 Hz) at 80 dB SPL in both ears. BF = 13.5 kHz.

References

    1. Bock GR, Steel KP. Use of albino animals for auditory research. Hear Res. 1984;13:201–202. - PubMed
    1. Chebat DR, Boire D, Ptito M. Development of the commissure of the superior colliculus in the hamster. J Comp Neurol. 2006;494:887–902. - PubMed
    1. Doron NN, Ledoux JE, Semple MN. Redefining the tonotopic core of rat auditory cortex: physiological evidence for a posterior field. J Comp Neurol. 2002;453:345–360. - PubMed
    1. Faye-Lund H. Projection from the inferior colliculus to the superior olivary complex in the albino rat. Anat Embryol (Berl) 1986;175:35–52. - PubMed
    1. Feliciano M, Saldaña E, Mugnaini A. Direct projections from the rat primary auditory neocortex to nucleus sagulum, paralemniscal regions, superior olivary complex and cochlea nuclei. Auditory Neurosci. 1995;1:287–308.

Publication types