. 2008 Sep 26;283(39):26805-19.
doi: 10.1074/jbc.M801516200. Epub 2008 Jul 28.

Mathematical model of nucleotide regulation on airway epithelia. Implications for airway homeostasis

Affiliations

Mathematical model of nucleotide regulation on airway epithelia. Implications for airway homeostasis

Peiying Zuo et al. J Biol Chem. .

Abstract

In the airways, adenine nucleotides support a complex signaling network mediating host defenses. Released by the epithelium into the airway surface liquid (ASL) layer, they regulate mucus clearance through P2 (ATP) receptors, and following surface metabolism through P1 (adenosine; Ado) receptors. The complexity of ASL nucleotide regulation provides an ideal subject for biochemical network modeling. A mathematical model was developed to integrate nucleotide release, the ectoenzymes supporting the dephosphorylation of ATP into Ado, Ado deamination into inosine (Ino), and nucleoside uptake. The model also includes ecto-adenylate kinase activity and feed-forward inhibition of Ado production by ATP and ADP. The parameters were optimized by fitting the model to experimental data for the steady-state and transient concentration profiles generated by adding ATP to polarized primary cultures of human bronchial epithelial (HBE) cells. The model captures major aspects of ATP and Ado regulation, including their >4-fold increase in concentration induced by mechanical stress mimicking normal breathing. The model also confirmed the independence of steady-state nucleotide concentrations on the ASL volume, an important regulator of airway clearance. An interactive approach between simulations and assays revealed that feed-forward inhibition is mediated by selective inhibition of ecto-5'-nucleotidase. Importantly, the model identifies ecto-adenylate kinase as a key regulator of ASL ATP and proposes novel strategies for the treatment of airway diseases characterized by impaired nucleotide-mediated clearance. These new insights into the biochemical processes supporting ASL nucleotide regulation illustrate the potential of this mathematical model for fundamental and clinical research.


Figures

FIGURE 1.
FIGURE 1.
Diagram of adenine nucleotides transport and metabolism on human bronchial epithelia. Released by the epithelium, ATP is sequentially dephosphorylated into Ado by E-NPPs, ecto-AK, NTPDase 1, NTPDase 3, NSAP, and ecto-5′-NT. Ado is converted into Ino by ADA1, both returning to the cytosol via CNT3. The model also includes the feed-forward inhibition of Ado production by ATP and ADP.
FIGURE 2.
FIGURE 2.
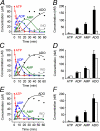
Validation of the transient and steady-state concentration profiles generated by the nonlinear model without data fitting (A and B) or by data fitting using the MatLab nonlinear least square program without (C and D) or with (E and F) JATP fixed at the experimental value. A, C, and E, simulation (lines) and experimental data (symbols; n = 5; S.E. <10% of mean) for nucleotide/nucleoside concentrations measured by HPLC of buffer samples collected from HBE cultures after the addition of 100 μm ATP (n = 6). B, D, and F, steady-state concentrations obtained by model simulation (empty bars) and experimental data (filled bars) from previous publications by our group (n = 5; ±S.E.) (12, 26).
FIGURE 3.
FIGURE 3.
Validation of the transient and steady-state concentration profiles generated by the model equations, including basal rates of ADP and AMP release. A, simulated (lines) and experimental (symbols; n = 5; S.E. <10% of mean) transient nucleotide/nucleoside concentration profiles generated by the addition of 100 μm ATP on HBE cultures. B, simulated (empty bars) and experimental (filled bars) steady-state concentration profiles from previous publications by our group (n = 5; ±S.E.) (12, 26).
FIGURE 4.
FIGURE 4.
Modeling the impact of ASL volume and mechanical stress mimicking tidal breathing on ASL nucleotide regulation. A, model simulation of the impact of increasing ASL volume by 2-fold (20 μl) on steady-state ATP/ADP concentrations. B, model validation by biochemical measurements of steady-state ATP concentration using soluble luciferase (solid black box) or cell-attached S. aureus protein A-luciferase (open box) on HBE cultures after the addition of 1-500 μl of phosphate-buffered saline (n = 5; ±S.E.). C, impact of CCS (solid red box) on the steady-state concentration profile. HBE cultures were exposed 1 h to static conditions (control) or CCS mimicking tidal breathing (20 cm H2O; 20 cycles/min) (10). Then ASL nucleotide concentrations were measured by HPLC (n = 7; ±S.E.). Model simulations conducted to reproduce the impact of CCS on the steady-state concentration profile by increasing the release rates of ATP (JATP; black box), ATP and ADP (JATP, ADP; striped box) or ATP, ADP and AMP (JATP, ADP, AMP; open box) by 9.3-fold (10). Values expressed as fold increase from static exposure.
FIGURE 5.
FIGURE 5.
Contribution of the low affinity and high affinity enzyme groups to ASL nucleotide regulation. A and B, simulations comparing hydrolysis rates of 100 μm ATP (A) or 1 μm ATP (B) under control conditions (solid black line) or after blocking highNSAP (solid red line), lowNSAP (solid blue line), or both (high/lowNSAP) (dashed blue line). Validation conducted on HBE cultures for control conditions (•) and high/lowNSAP inhibition by 10 mm levamisole (open blue box). C and D, simulated metabolic profile for 100 μm ATP before (solid line) and after (dashed line) blocking the low affinity (LA; lowNSAP and NTPDase 3) (C) or high affinity (HA; NTPDase 1, highNSAP, E-NPPs, and ecto-AK) enzymes (D). Validation for the control (C and D, filled symbols) and low affinity block (C; open symbols) using an inhibitor mixture (10 mm levamisole + 10 μm NF-279) (n = 5; S.E. <10% of mean). E, simulated half-life (t½) of 0.1-100 μm ATP generated by blocking the high affinity (solid black box) or low affinity (striped box) group, and experimental data (solid red box) for the low affinity block as above (n = 5; ±S.E.). F, simulated impact of blocking the high affinity (solid black box) or low affinity (striped box) group on the steady-state profile. Validation (solid red box) was by comparing ASL nucleotide levels before/after incubating HBE cultures with the low affinity inhibitor mixture (n = 5; ±S.E.).
FIGURE 6.
FIGURE 6.
Role of ecto-AK in ASL nucleotide regulation. A, reaction directionality during nucleotide aerosolization (>10 μm ATP) and under steady-state conditions (1-10 nm ATP) with ADP/ATP >20 (Table 3). B-D, simulations (lines) of the impact of blocking ecto-AK on the metabolism of 100 μm ATP (B) in the presence of all enzymes and after blocking (C) the high affinity (NTPDase 1, highNSAP, and E-NPPs) or (D) low affinity (LA; lowNSAP and NTPDase 3) enzymes. B, validation using HBEs pretreated with the vehicle (closed symbols) or the ecto-AK inhibitor (0.5 mm Ap5A; open symbols). D, validation on HBEs pretreated with the low affinity inhibitor mixture (10 mm levamisole + 10 μm NF-279) without (closed symbols) or with (open symbols) 0.5 mm Ap5A (n = 6; S.E. < 10% of mean). E, impact of blocking ecto-AK on the steady-state profile by stimulation (solid black box) or exposing HBEs to 0.5 mm Ap5A (solid red box) (n = 5; ±S.E.). Data were compared with the simulated impact of blocking the other high affinity enzymes (open box).
FIGURE 7.
FIGURE 7.
Relative contribution of ecto-5NT and NSAP to Ado regulation. A-C, simulated (lines) and experimental (symbols) time courses of Ado accumulation from 0.1 to 10 μm ATP under control conditions and after blocking ecto-5′-NT (solid red line) or NSAP (solid blue line) activities. For NSAP, simulations were run by blocking the parameters regulating AMP (NSAP (AMP)) (dashed blue line) or all nucleotides (NSAP (all)) (solid blue line). Experimental data using HBE cultures were incubated with 0.1-10 μm ATP, without/with an inhibitor of ecto-5′-NT (10 mm concanavalin A) (open red triangle), or NSAP (all) (10 mm levamisole) (open blue box) (n = 6; S.E. < 10% of mean). D, simulated (solid black box) and experimental (solid red box) delay to the accumulation of 0.3 μm Ado from 1 to 1000 μm ATP. Simulations also compared the impact of blocking ecto-5′-NT with (striped box) or without (open box) feed-forward inhibition (formula image, formula image block; Table 1, column C). E, simulated (solid black box) and experimental (solid blue box; n = 5, p < 0.05) impact of blocking NSAP (all) on the delay to reach 0.3 μm Ado (fold from controls in D). Simulated impact of blocking both NSAP (all) and feed-forward inhibition (striped black box) is shown. F, simulated impact of blocking NSAP (all) (solid black box) or ecto-5′-NT (open box) on the steady-state profile. Experimental block of NSAP (all) (solid blue box) or ecto-5′-NT (solid red box) was obtained by measuring nucleotide levels before/after incubating cultures with the inhibitors (n = 5, p < 0.05).

References

    1. Boucher, R. C. (2003) Pfluegers Arch. 445 495-498 - PubMed
    1. Boucher, R. C. (2007) J. Int. Med. 261 5-16 - PubMed
    1. Davis, C. (2002) Norvatis Found. Symp. 248 113-125 - PubMed
    1. Williams, O. W., Sharafkhaneh, A., Kim, V., Dickey, B. F., and Evans, C. M. (2006) Am. J. Respir. Cell Mol. Biol. 34 527-536 - PMC - PubMed
    1. Donaldson, S. H., and Boucher, R. C. (1998) in The P2 Nucleotide Receptors (Turner, J. T., Weisman, G. A., and Fedan, J. S., eds) pp. 413-424, Humana Press Inc., Totowa, NJ

Publication types

Substances