. 2008 Oct 10;283(41):27565-27574.
doi: 10.1074/jbc.M804393200. Epub 2008 Jul 28.

Glyceroneogenesis is the dominant pathway for triglyceride glycerol synthesis in vivo in the rat

Affiliations

Glyceroneogenesis is the dominant pathway for triglyceride glycerol synthesis in vivo in the rat

Colleen K Nye et al. J Biol Chem. .

Abstract

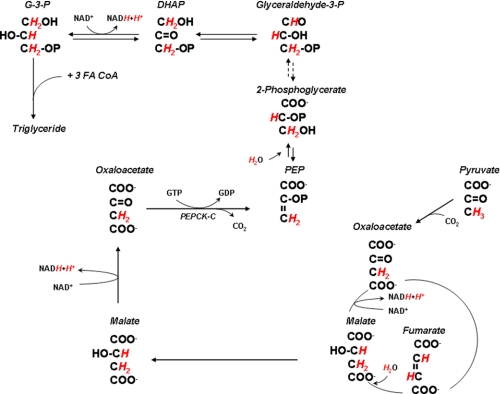
Triglyceride synthesis in mammalian tissues requires glycerol 3-phosphate as the source of triglyceride glycerol. In this study the relative contribution of glyceroneogenesis and glycolysis to triglyceride glycerol synthesis was quantified in vivo in adipose tissue, skeletal muscle, and liver of the rat in response to a chow diet (controls), 48-h fast, and lipogenic (high sucrose) diet. The rate of glyceroneogenesis was quantified using the tritium ([(3)H(2)]O) labeling of body water, and the contribution of glucose, via glycolysis, was determined using a [U-(14)C]glucose tracer. In epididymal and mesenteric adipose tissue of control rats, glyceroneogenesis accounted for approximately 90% of triglyceride glycerol synthesis. Fasting for 48 h did not alter glyceroneogenesis in adipose tissue, whereas the contribution of glucose was negligible. In response to sucrose feeding, the synthesis of triglyceride glycerol via both glyceroneogenesis and glycolysis nearly doubled (versus controls); however, glyceroneogenesis remained quantitatively higher as compared with the contribution of glucose. Enhancement of triglyceride-fatty acid cycling by epinephrine infusion resulted in a higher rate of glyceroneogenesis in adipose tissue, as compared with controls, whereas the contribution of glucose via glycolysis was not measurable. Glyceroneogenesis provided the majority of triglyceride glycerol in the gastrocnemius and soleus. In the liver the fractional contribution of glyceroneogenesis remained constant (approximately 60%) under all conditions and was higher than that of glucose. Thus, glyceroneogenesis, in contrast to glucose, via glycolysis, is quantitatively the predominant source of triglyceride glycerol in adipose tissue, skeletal muscle, and liver of the rat during fasting and high sucrose feeding.


Figures

FIGURE 1.
FIGURE 1.
Isotopic tracer study protocol. Rats were given 0. 5 mCi of [3H2]O at time 0 followed by a prime constant-rate infusion of [U-14C]glucose (prime = 9 μCi/kg; constant infusion = 9 μCi/kg/h) for 7 h. Animals moved freely about their cages during the study. Blood samples were collected during the final hour of the infusion, and tissues of interest were harvested while the tracer infusion was continued.
FIGURE 2.
FIGURE 2.
The incorporation of 3H into G-3-P from body water. Hydrogens of C-3 of pyruvate become labeled through exchange with body water during transamination with alanine and keto-enol tautomerization as well as during the equilibrium of malate with fumarate so that both hydrogens of C-3 of phosphoenolpyruvate, which forms the C-3 of glyceraldehyde-3-P, will have the same SA as that of body water. Additional labeling occurs at the level of the triose phosphate pool when C-1 and C-2 acquire 3H directly from the body water. Thus, the 3H of C-1 and C-2 of G-3-P were derived from the triose phosphate pool. The 3H of C-3 of G-3-P were derived entirely from pyruvate. Hydrogens labeled with 3H are highlighted in red.
FIGURE 3.
FIGURE 3.
The relative contribution of glyceroneogenesis and of glucose by the direct and indirect (via lactate) pathways and its impact on the 14C/3H ratio of C-1 and C-3 of triglyceride glycerol. The box represents the labeling pattern of G-3-P derived from [14C]glucose, [3H]pyruvate, and [14C]lactate. When G-3-P is formed from [14C]glucose, all the carbons of G-3-P will be equally labeled with 14C. In contrast, 3H, as a result of equilibrium in the triosephosphate pool (Fig. 2), will appear on C-1 and C-2 and not C-3. G-3-P formed from pyruvate will not have any 14C label, whereas the hydrogens on C-1, C-2, and C-3 will be completely labeled with 3H. On a stoichiometric equivalent basis, G-3-P formed from 1 molecule of glucose and 2 molecules of pyruvate will have a 14C/3H ratio on C-1 of 2 14C/8 3H = 0.25 and on C-3 of 2 14C/4 3H = 0.5. 14C of glucose can also be incorporated into G-3-P via [14C]lactate. However, as a result of randomization and the exchange of label in the TCA cycle, [14C]lactate entering the triose phosphate pool will have less label on C-1 relative to C-2 and C-3. Therefore, as the contribution of recycled glucose (via lactate) to G-3-P increases, there will be an increase in the 14C/3H ratio on C-3 and a decrease of the ratio on C-1. Thus, a high glyceroneogenic flux, relative to glycolytic flux, will result in a high 14C/3H ratio on C-3 (or C-1 + C-3) as compared with that on C-1. Carbons labeled with 14C are highlighted in blue, and hydrogens labeled with 3H are highlighted in red. PEP, phosphoenolpyruvate.
FIGURE 4.
FIGURE 4.
The activity of PEPCK-C in adipose tissue. Epididymal and mesenteric adipose tissue was collected from 48-h-fasted animals (gray bars) and from animals maintained on a sucrose supplemented diet and infused with glucose (black bars). The activity of PEPCK-C was determined in these tissues as described under “Experimental Procedures” and is expressed as the mean ± S.E. for three rats. A unit of activity is defined as 1 μmol of substrate converted to product/min/g tissue at 37 °C. *, p < 0.05; **, p < 0.01 versus 48 h fast.
FIGURE 5.
FIGURE 5.
The two compartment (or two cell-type) hypothesis. Two different cell types exist within an adipose tissue depot; 1) undifferentiated adipocytes which do not synthesize triglyceride and are predominantly glycolytic (left side); 2) differentiated adipocytes which display the phenotype characteristic of mature adipocytes (namely a large triglyceride reservoir) and synthesize triglyceride (right side). The differentiated adipocytes may rely mostly on glyceroneogenesis for the deposition of triglyceride.

References

    1. Newsholme, E. A., and Crabtree, B. (1976) Biochem. Soc. Symp. 61-109 - PubMed
    1. Reshef, L., Olswang, Y., Cassuto, H., Blum, B., Croniger, C. M., Kalhan, S. C., Tilghman, S. M., and Hanson, R. W. (2003) J. Biol. Chem. 278 30413-30416 - PubMed
    1. Robinson, J., and Newsholme, E. A. (1967) Biochem. J. 104 2-4 - PubMed
    1. Newsholme, E. A., and Taylor, K. (1969) Biochem. J. 112 465-474 - PMC - PubMed
    1. Ballard, F. J., Hanson, R. W., and Leveille, G. A. (1967) J. Biol. Chem. 242 2746-2750 - PubMed

Publication types

LinkOut - more resources