. 2008 Oct 10;283(41):27957-27972.
doi: 10.1074/jbc.M803467200. Epub 2008 Jul 28.

Critical and distinct roles of p16 and telomerase in regulating the proliferative life span of normal human prostate epithelial progenitor cells

Affiliations

Critical and distinct roles of p16 and telomerase in regulating the proliferative life span of normal human prostate epithelial progenitor cells

Bobby Bhatia et al. J Biol Chem. .

Abstract

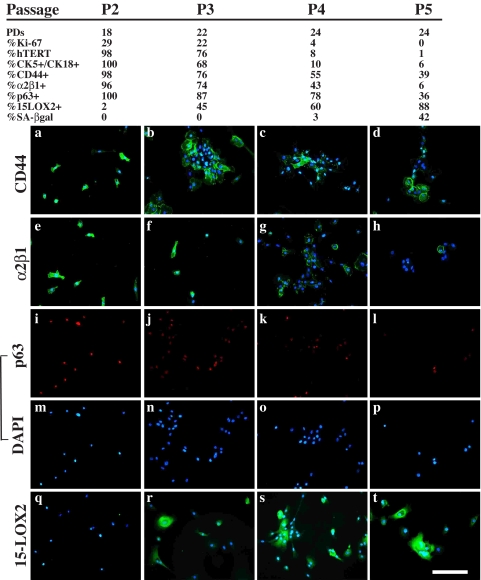
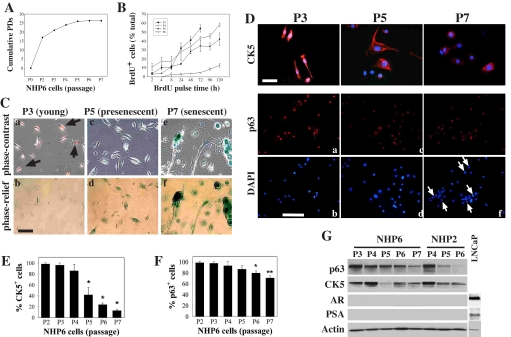
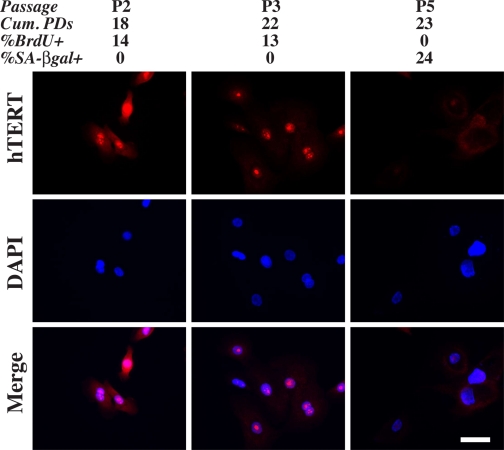
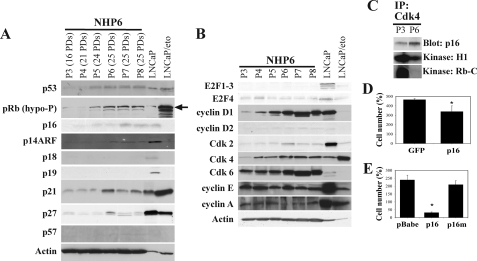
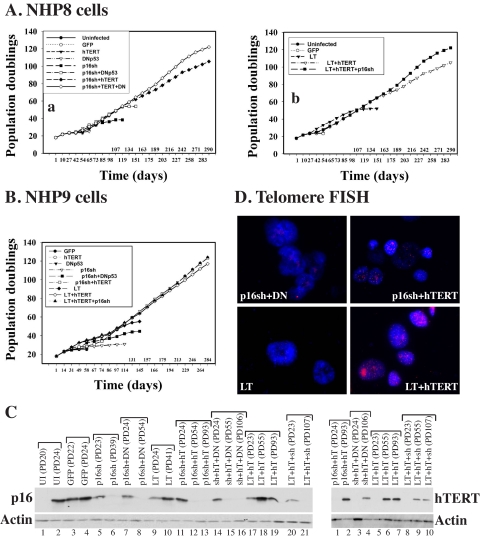
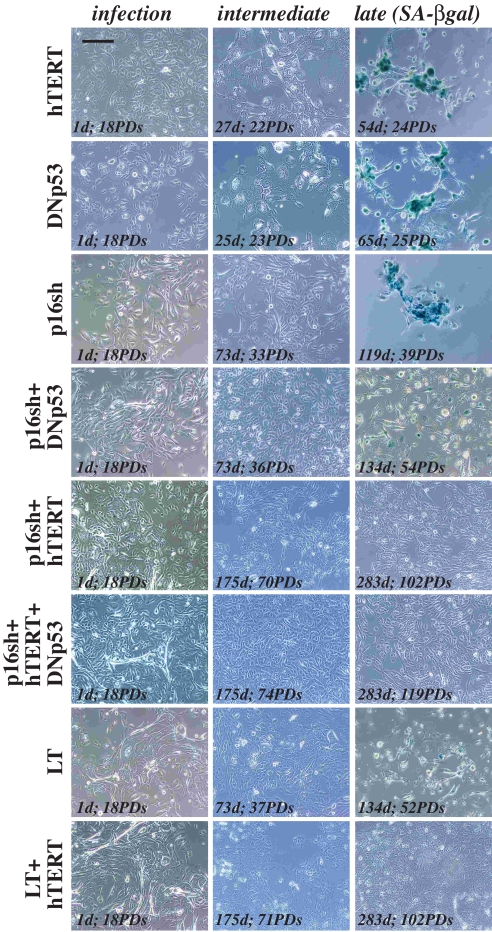
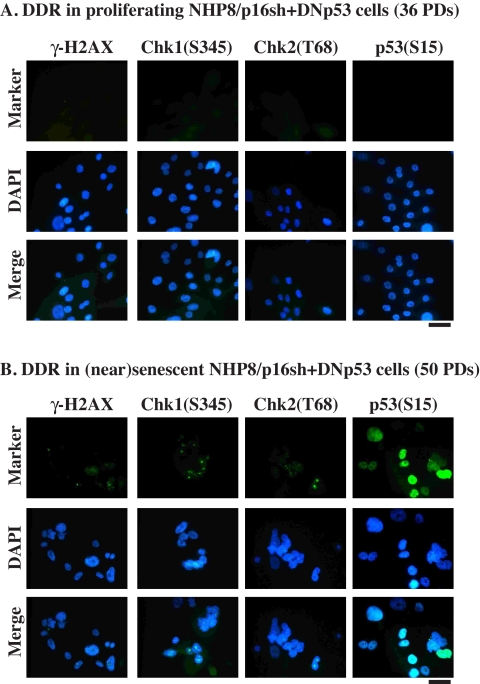
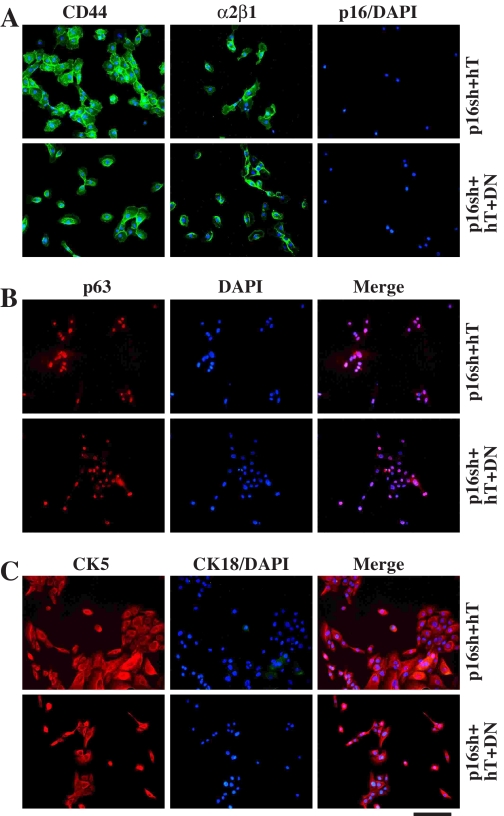
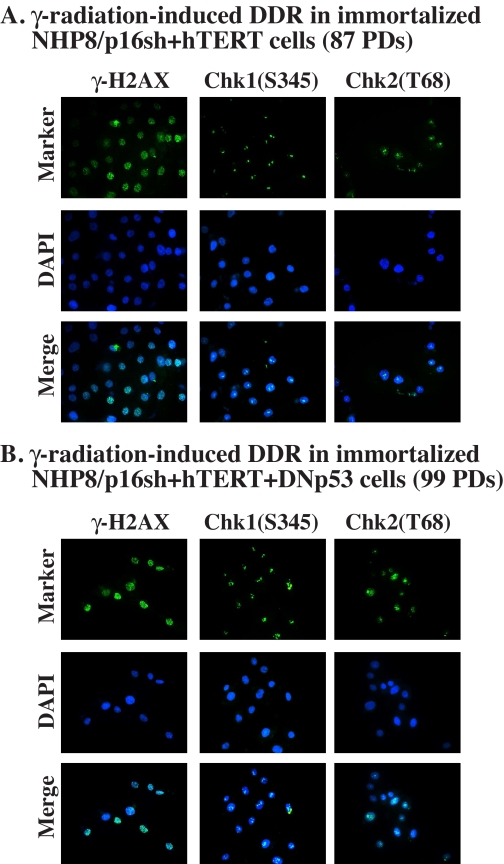
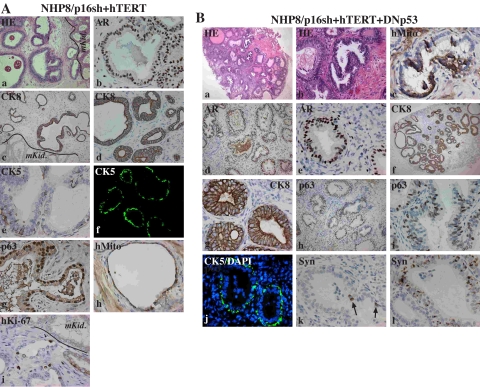
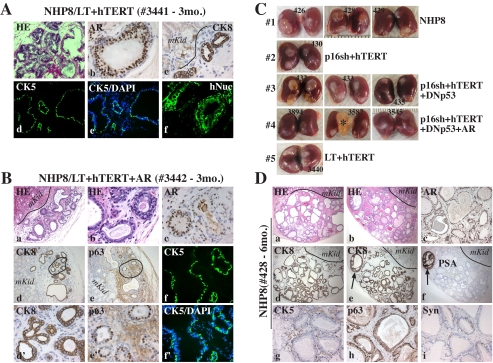
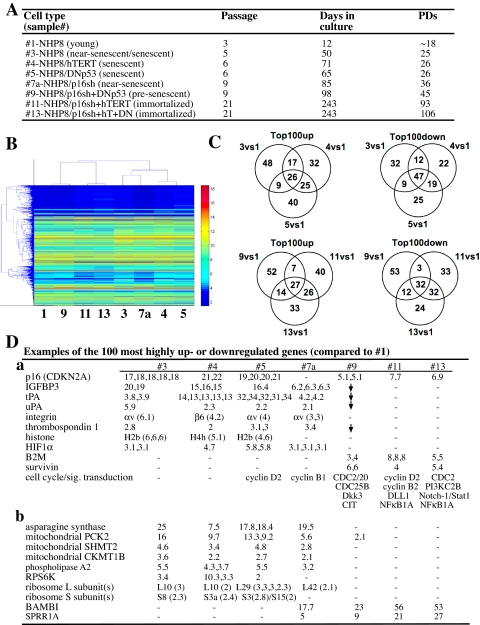
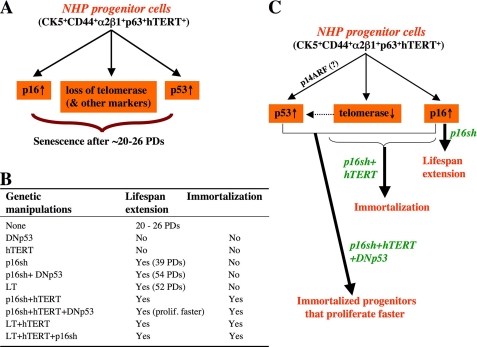
Normal human prostate (NHP) epithelial cells undergo senescence in vitro and in vivo, but the underlying molecular mechanisms remain obscure. Here we show that the senescence of primary NHP cells, which are immunophenotyped as intermediate basal-like cells expressing progenitor cell markers CD44, alpha2beta1, p63, hTERT, and CK5/CK18, involves loss of telomerase expression, up-regulation of p16, and activation of p53. Using genetically defined manipulations of these three signaling pathways, we show that p16 is the primary determinant of the NHP cell proliferative capacity and that hTERT is required for unlimited proliferative life span. Hence, suppression of p16 significantly extends NHP cell life span, but both p16 inhibition and hTERT are required to immortalize NHP cells. Importantly, immortalized NHP cells retain expression of most progenitor markers, demonstrate gene expression profiles characteristic of proliferating progenitor cells, and possess multilineage differentiation potential generating functional prostatic glands. Our studies shed important light on the molecular mechanisms regulating the proliferative life span of NHP progenitor cells.


Figures

FIGURE 1.
FIGURE 1.
Cultured NHP8 cells lose progenitor cell markers as they lose proliferative capacity. NHP8 cells at different passages were immunostained for the molecules indicated on top and counterstained by 4′,6-diamidino-2-phenylindole (DAPI). The passage number, cumulative PDs, and the percentages of proliferating (i.e. Ki-67+), hTERT+, CK5+/CK18+, p63+, CD44+, α2β1+, 15-LOX2+, and SA-β-galactosidase+ cells are indicated. Shown below are some representative microphotographs. Shown are cells at P2 (panels a, e, i, m, and q), P3 (panels b, f, j, n, and r), P4 (panels c, g, k, o, and s), and P5 (panels d, h, l, p, and t).
FIGURE 2.
FIGURE 2.
NHP6 progenitor cells in culture lose progenitor markers and proliferative capacity and become senescent. A, cumulative PDs of NHP6 cells cultured in serum/androgen-free PrEBM(EGF + Ins). B, cumulative BrdUrd labeling. The percentage of BrdUrd+ cells was determined by counting 500-1000 cells for each passage (values represent the mean ± S.E. from two experiments). C, representative photomicrographs showing NHP6 cells at P3, P5, and P7 stained for BrdUrd (10 μm × 4 h; red) and SA-β-galactosidase (blue). The images in the lower panels were taken using the phase relief contrast filter to better reveal the SA-β-galactosidase staining. Bar, 2 μm. D, NHP6 cells stained for CK5 (top panels; bar, 2 μm) or p63 (lower panels; bar, 10 μm). The arrows in f indicate the cells that have lost p63 labeling. E and F, quantification of filamentous CK5-positive (E) or p63-positive (F) cells. 600-1200 cells were counted for each passage, and the data represent mean ± S.E. from 2-3 independent counts. E,*, p < 0.01. F,*, p < 0.05; **, p < 0.01. G, Western blotting analysis of marker molecules in NHP6 and NHP2 cells. LNCaP cells were used as positive control for AR and PSA.
FIGURE 3.
FIGURE 3.
Loss of hTERT expression accompanies NHP7 cell senescence. NHP7 cells at different passages were stained for hTERT. The percentages of hTERT+ cells at P2, P3, and P5, were 99, 70, and 2%, respectively (a total of 1000-1300 cells counted). The passage number, cumulative PDs, and percentages of BrdUrd- and SA-β-galactosidase-positive cells are indicated on top. In these experiments, the NHP7 cells at different passages were BrdUrdpulsed for 4 h. Bar, 2 μm. DAPI, 4′,6-diamidino-2-phenylindole.
FIGURE 4.
FIGURE 4.
NHP cell senescence involves both p16/pRb and p53 pathways. A, negative cell cycle regulators. Whole cell lysates (100 μg/lane) were used in Western blotting. The antibody for pRb recognizes only the hypophosphorylated (active) form. LNCaP cells (having wild type p53) were used as control (30 μg/lane), which showed up-regulated p53 and p21 as well as active pRb in response to etoposide (eto;10 μm for 48 h). Note that etoposide treatment decreased p16, p19, and p27 in LNCaP cells. B, Western blotting analysis of positive cell cycle regulators. Note that in LNCaP cells, etoposide treatment decreased all positive cell cycle regulators except Cdk4, which actually increased. C, P3 or P6 NHP6 cells (107 cells) were used in immunoprecipitation (IP) using anti-Cdk4 antibody. The immunoprecipitates were run on Western blot, and the blot was probed for p16 (top) or used in kinase assays using either histone H1 (middle) or Rb peptide (bottom) as the substrate. Note that immunoprecipitation using the control RgIgG antibody did not reveal a specific band (not shown). D, NHP8 cells (P3; 20 PDs) were plated at 250,000 cells/T25 and infected with either pLXSN-p16 (p16) or the control vector pLEGFP (GFP). Cell number was determined 26 days after infection and selection with G418 (200 μg/ml). Bars, mean ± S.D. E, NHP8 cells (P3; 20 PDs) were plated at 250,000 cells/T25 and infected with the empty vector (pBabe), pBabe-p16 (p16), or pBabe-p16R418 (p16m). Cell number was determined 9 days after infection and selection with puromycin (1 μg/ml). Bars, mean ± S.D. *, p < 0.01 for D and E.
FIGURE 5.
FIGURE 5.
Genetically defined life span extension and immortalization of NHP progenitor cells. NHP8 (A) or NHP9 (B) cells were infected at PD18 with the indicated vectors, either individually or in different combinations. Cumulative PDs were determined in continuous cultures. C, Western blotting (25 μg/lane) showing the down-regulation of p16 by p16sh (left) or overexpression of hTERT (right) in the hTERT (hT)-infected long term NHP cells. Note that in lanes with low PDs (i.e. recently infected cultures) p16 suppression was not complete or hTERT overexpression was not obvious, because cultures were still mixtures containing both infected and uninfected cells. UI, uninfected; p16sh or sh, cells infected with p16 shRNA; LT, large T; DN, dominant negative p53. D, telomere FISH analysis showing loss of telomere in near senescent NHP8 cells infected with p16sh plus DNp53 (DN) or large T and strong telomere FISH signals in NHP8 cells infected with either p16sh plus hTERT or large T plus hTERT (both at ∼85 PDs). Note that young NHP8 cells showed telomere FISH signals similar to those in NHP8/p16sh + hTERT cells (data not shown due to space constraints), consistent with the immunostaining results (Fig. 1, P2).
FIGURE 6.
FIGURE 6.
Genetically defined immortalization of NHP progenitor cells. Representative images of NHP8 cells infected with retroviral vectors encoding the molecules indicated on the left. Three representative images are shown. Note that uninfected and GFP-infected cells (not shown) behaved like the hTERT- and DNp53-infected cells. Bar, 10 μm.
FIGURE 7.
FIGURE 7.
DDR in near senescent/senescent (PD50) NHP8/p16sh + DNp53 cells but not in proliferating (PD36) cells. The cells indicated were immunostained for phosphorylated H2AX, Chk1, Chk2, or p53, using the antibodies listed in Table S1. Bars, 2 μm. DAPI, 4′,6-diamidino-2-phenylindole.
FIGURE 8.
FIGURE 8.
Immunophenotyping of the immortalized NHP8/p16sh + hTERT (78 PDs) and NHP8/p16sh + hTERT + DNp53 (86 PDs) cells. Representative images of the infected NHP8 cells stained for surface markers CD44 or α2β1(A), nuclear marker p63 (B), and cytoskeletal markers CK5/CK18 (C). Bar, 2 μm.
FIGURE 9.
FIGURE 9.
Normal DDR in immortalized NHP8/p16sh+hTERT (A) or NHP8/p16sh + hTERT + DNp53 (B) cells. Cells at the indicated PDs were irradiated with 20-gray x-ray for 10 min and then fixed and immunostained for phosphorylated H2AX, Chk1, or Chk2 using the antibodies listed in Table S1. Note that the phosphorylated γ-H2AX was detected as discrete intranuclear granules, whereas phosphorylated Chk1 and Chk2 were generally detected as intranuclear speckles or dots. The staining intensities were significantly increased in cells irradiated for 45 min (not shown). Treatment of cells with another DNA damage agent, etoposide, induced very similar DDR (not shown). Note that cells without treatments or stained with secondary antibody alone did not reveal any specific staining. DAPI, 4′,6-diamidino-2-phenylindole.
FIGURE 10.
FIGURE 10.
Immortalized NHP progenitor cells differentiate into prostatic glands in vivo. Shown is hematoxylin/eosin (HE) and immunohistochemical (IHC) staining of TRs of NHP8/p16sh + hTERT (A; number 431; Table 3) or NHP8/p16sh + hTERT + DNp53 (B; number 434) cells 3 months (mo.) after transplantation. Most were paraffin-embedded sections except for A (f) and B (j) (cryosections). The arrows in B (k) indicate scattered synaptophysin-positive cells. CK5 and CK8, cytokeratin 5 and 8, respectively; hMito, human mitochondria; hKi-67, human-specific Ki-67; Syn, synaptophysin; mKid, mouse kidney. DAPI, 4′,6-diamidino-2-phenylindole.
FIGURE 11.
FIGURE 11.
Immortalized NHP progenitor cells differentiate into prostatic glands in vivo. Hematoxylin/eosin and immunohistochemical (IHC) staining of tissue recombinants derived from the indicated cell types either 3 months (A and B) or 6 months (C and D) after transplantation. Animal numbers are indicted (Table 3). CK8, cytokeratin 8; CK5, cytokeratin 5; hMito, human mitochondria; hKi-67, human-specific Ki-67; Syn, synaptophysin; mKid, mouse kidney. Note that AR and CK8-positive cells are localized in the luminal layer (A (b and c) and B (c and d′)), whereas CK5 specifically labels basal cells (A (d and e), B (f and f′), and D (g)). p63-positive cells are observed in both luminal and basal cells (B (e′) and D (h)). A, a and d-f, cryosections; b and c, paraffin-embedded sections. In B, f and f′ show cryosections, and the rest are paraffin-embedded sections. d′ and e′, enlarged microphotographs of d and e (circled), respectively. C, representative images of TR outgrowths at 6 months after renal capsule transplantation. Five cell types are shown, and individual animal numbers are indicated (Table 3). Note that the large outgrowth in animal 3587 (4; asterisk) was found to be negative for CK8, p63, and hMito (data not shown); therefore, it was probably derived from the contaminated rat epithelium. D, shown are two representative glandular outgrowths (a and b) derived from regular NHP8 cells in animal 428 (Table 3). Note the specific CK8 staining of glandular structures but not mouse kidney cells. The only PSA-positive gland is also positive for CK8 (e and f, arrows). Similar results were observed in glands in animal 426 (Table 3) with also one strongly stained PSA-positive gland (not shown). The prostatic glands in animal 429 did not show any PSA staining (not shown). DAPI, 4′,6-diamidino-2-phenylindole.
FIGURE 12.
FIGURE 12.
Gene expression profiling of young, senescent, and immortalized NHP cells. A, NHP cells used in microarray analysis. “Near senescent” means approaching full senescence (e.g. 7a-NHP8/p16sh cells at 36 PDs; these cells had a total life span of ∼39 PDs). “Presenescent” means further away from senescence (e.g. 9-NHP8/p16sh + DNp53 cells at 45 PDs; these cells had a total life span of 54 PDs). B, hierarchical clustering of the samples based on the intersection of the significant genes (i.e. 1585 genes) using 1-correlation as distance and average linkage and the absolute intensity values on each channel. The genes (y axis) are sorted in ascending order of mean intensity. C, Venn diagram presentations of the 100 most highly up-regulated and down-regulated genes. See “Materials and Methods” for details. D, examples of 100 most highly up-regulated (a) or down-regulated (b) genes. The numbers indicate -fold changes, and some genes (e.g. p16) show changes with multiple probe sets. -, no increase in the 100 most highly up/down-regulated gene lists. ↓, decreased expression levels. CIT, Rho-interacting, serine/threonine kinase 21; CKMT1B; creatine kinase, mitochondrial 1B; Dkk3, Dickkopf homolog 3; delta-like 1; PCK2, phosphoenolpyruvate carboxykinase 2; RPS6K, ribosomal protein S6 kinase; SHMT2, serine hydroxymethyltransferase 2.
FIGURE 13.
FIGURE 13.
Critical and distinct roles of p16, hTERT, and p53 in NHP cell replicative life span. A, NHP cell senescence involving changes in p16, telomerase, and p53. B, summary of genetic manipulations in NHP cells in this study. C, NHP cell immortalization. Cultured NHP cells up-regulate p16, lose telomerase, and activate p53. p53 activation results possibly from both early p14ARF up-regulation and late telomere erosion (due to p16sh-conferred, continued cell proliferation in the absence of telomerase). p16sh extends NHP cell-proliferative life span, but both p16sh and hTERT are required to immortalize NHP cells.

References

    1. Tang, D. G., Patrawala, L., Calhoun, T., Bhatia, B., Choy, G., Schneider-Broussard, R., and Jeter, C. (2007) Mol. Carcinog. 46 1-14 - PubMed
    1. Oudes, A. J., Campbell, D. S., Sorensen, C. M., Walashek, L. S., True, L. D., and Liu, A. Y. (2006) BMC Genomics 7 92. - PMC - PubMed
    1. Senoo, M., Pinto, F., Crum, C. P., and McKeon, F. (2007) Cell 129 523-536 - PubMed
    1. Wang, Y., Hayward, S., Cao, M., Thayer, K., and Cunha, G. (2001) Differentiation 68 270-279 - PubMed
    1. Robinson, E. J., Neal, D. E., and Collins, A. T. (1998) Prostate 37 149-160 - PubMed

Publication types