

doi: 10.1084/jem.20080397.
Epub 2008 Jul 28.
Human interleukin 17-producing cells originate from a CD161+CD4+ T cell precursor
Affiliations
- PMID: 18663128
- PMCID: PMC2525581
- DOI: 10.1084/jem.20080397
Item in Clipboard
Human interleukin 17-producing cells originate from a CD161+CD4+ T cell precursor
J Exp Med.
.
Abstract
We demonstrate that CD161 is a highly up-regulated gene in human interleukin (IL) 17 T helper cell (Th17) clones and that all IL-17-producing cells are contained in the CD161(+) fraction of CD4(+) T cells present in the circulation or in inflamed tissues, although they are not CD1-restricted natural killer T cells. More importantly, we show that all IL-17-producing cells originate from CD161(+) naive CD4(+) T cells of umbilical cord blood, as well as of the postnatal thymus, in response to the combined activity of IL-1 beta and IL-23. These findings implicate CD161 as a novel surface marker for human Th17 cells and demonstrate the exclusive origin of these cells from a CD161(+)CD4(+) T cell progenitor.
Figures

Human Th17 clones express the NKT cell marker CD161. (A) Volcano plot representation (log2 fold change vs. t test p-value) between Th17 and Th1 (left) or Th2 (right) cell gene expression profiles. (B) CD161 mRNA levels were measured by real-time quantitative RT-PCR in Th1, Th2, and Th17 clones. Bars represent mean values ± SE obtained in 10 clones from each type different from those used for the microarray assay. (C) Representative flow cytometric analysis of CD161 surface expression for each type of clone. The gates were placed on the basis of an isotype-matched control mAb. Percentages of gated cells are shown.

Circulating IL-17–producing cells are contained in the CD161+CCR6+ fraction of circulating CD4+ T cells from adult subjects. (A) Detection of IL-17 and IFN-γ production and expression of RORγt, IL-23R, and CCR6 mRNA in CD161-depleted (black plot and bars) and CD161-enriched (red plot and bars) circulating CD4+ T cells from healthy adult subjects. Representative flow cytometric analysis (top) and mean values of cytokine-producing cell percentages ± SE obtained in seven different donors (bottom) are shown. (B) IL-17 and IFN-γ production in circulating CD161−CCR6−, CD161−CCR6+, CD161+CCR6−, and CD161+CCR6+ CD4+ T cells from one representative experiment out of three performed is shown. RORγt and IL-23R mRNA expression in the indicated cell populations is shown. Bars represent mean values ± SE obtained in three separate experiments. Percentages of gated cells are shown.
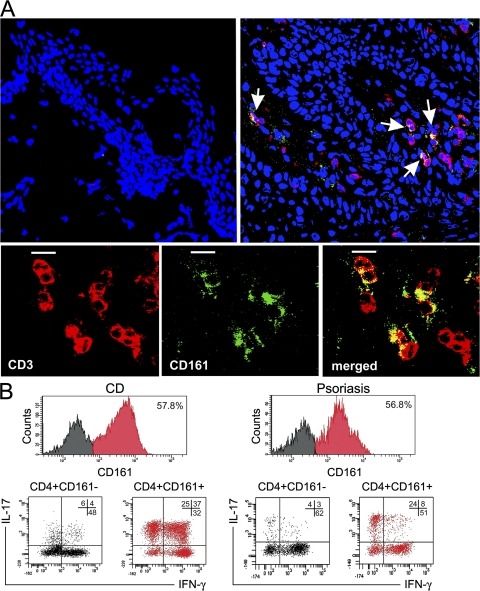
Detection of CD161+ T cells in inflamed tissues and demonstration of their ability to produce IL-17. (A) Evaluation of the expression of CD3 (red) and CD161 (green) in skin from a healthy donor (top left) or in lesional skin from a psoriatic patient (top right) by confocal microscopy. Arrows point to cells showing double labeling for CD3 and CD161 (yellow) in the skin of the psoriatic patient. TO-PRO-3 (Invitrogen) counterstained nuclei. (bottom) A close-up of CD3+CD161+ double-positive cells (merged; yellow) is shown. Images obtained in the skin of one out of three healthy or psoriatic donors are depicted. Bars, 10 μm. (B) Infiltrating T cells recovered from gut areas of subjects with CD or skin biopsies of subjects with psoriasis were expanded in vitro for 1 wk and assessed for CD161 expression, as well as for their ability to produce IFN-γ and IL-17 after stimulation with PMA plus ionomycin. Representative flow cytometric analysis obtained in one out of three subjects with CD and in one out of three subjects with psoriasis are shown. Percentages of gated cells are shown.
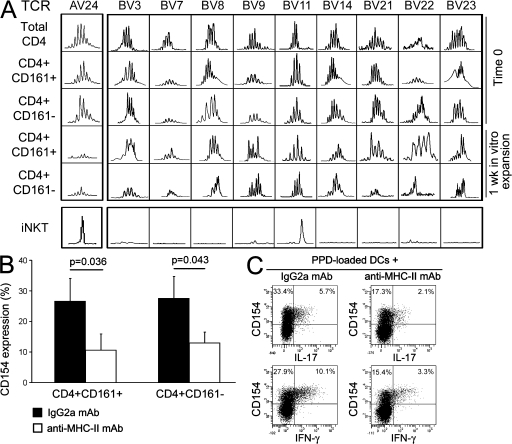
Circulating CD4+CD161+ Th17 cells are not NKT, but NKT-like, cells. (A) The TCR Vα24 and TCR Vβ repertoires were determined by CDR3 length analysis evaluated by spectratyping. The TCR Vα24 and TCR Vβ repertoires were assessed on freshly isolated (total CD4+, CD4+CD161+, and CD4+CD161− T cells) and on 1-wk in vitro–expanded CD4+CD161+ and CD4+CD161− T cells. Representative families of different Vβ chains assessed (BV3, BV7, BV8, BV9, BV11, BV14, BV21, BV22, and BV23) are depicted. One representative out of three different experiments is shown. CDR3 length analysis of Vα24 and Vβ11 in iNKT cells is also shown. (B) CD4+CD161+ and CD4+CD161− T cells were stimulated for 8 h with allogeneic DCs in the presence of an anti–MHC class II or an isotype control mAb, and were then assessed for CD154 expression. Bars represent mean values ± SE of percentages of CD154+ cells obtained in four different experiments. (C) A PPD-specific short-term T cell line highly enriched in IL-17–producing cells was stimulated for 8 h with PPD-loaded autologous DCs in the presence of an anti–MHC class II or an isotype control mAb. CD154 and cytokine expression were assessed by flow cytometry. Percentages of gated cells are shown.
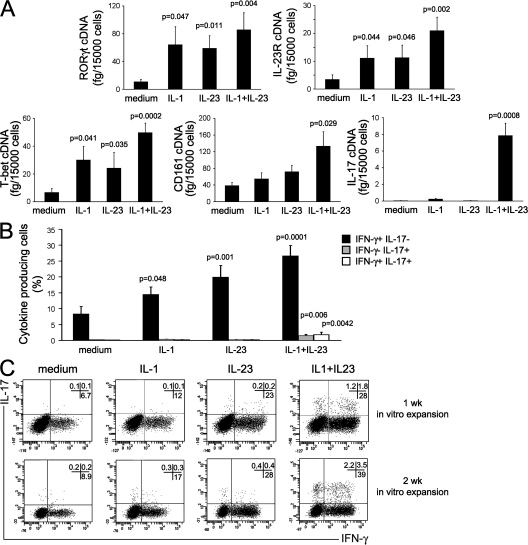
IL-17–producing cells can develop from UCB T cells in the presence of IL-1β plus IL-23. CD4+ T cells purified from UCB were stimulated for 7 d with anti-CD3 plus anti-CD28 mAb in the presence or absence of the indicated cytokines. (A) RORγt, T-bet, IL-23R, CD161, and IL-17 mRNA levels were measured by real-time quantitative RT-PCR. Bars represent mean values ± SE obtained from 13 donors. (B) Cells were also assessed by flow cytometry for their ability to produce IFN-γ alone (black bars), IL-17 alone (gray bars), or both (white bars) after stimulation with PMA plus ionomycin. Bars represent mean values ± SE obtained from 13 donors. (C) Representative flow cytometric analysis on UCB CD4+ T cells after stimulation with anti-CD3 plus anti-CD28 mAb, in the presence or absence of the indicated cytokines, performed after 1 wk (top) or 2 wk (bottom) of in vitro expansion. p-values refer to the comparison between cultures performed in the presence of the indicated cytokines versus those performed in the presence of medium alone. Percentages of gated cells are shown.
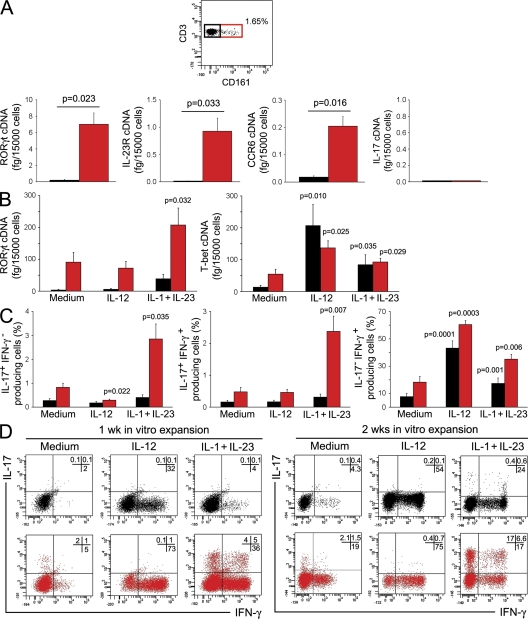
UCB CD161+CD4+ T cells constitutively express RORγt, IL-23R, and CCR6 mRNA and differentiate into Th17 cells in response to IL-1β plus IL-23. (A) Flow cytometric detection of CD161+ cells among UCB CD4+ T cells and measurement of RORγt, IL-23R, CCR6, and IL-17 mRNA levels in CD161-depleted (black bars) and CD161-enriched (red bars) unstimulated UCB CD4+ T cells. Bars represent mean values ± SE obtained in seven different donors. (B) CD4+CD161+ (red bars) and CD4+CD161− (black bars) T cells were stimulated for 7 d with anti-CD3 plus anti-CD28 mAb in the presence or absence of the indicated cytokines. RORγt and T-bet mRNA levels were measured by real-time quantitative RT-PCR. Bars represent mean values ± SE obtained from six donors. (C) The same cell fractions as in B were assessed by flow cytometry for their ability to produce IFN-γ and IL-17 after stimulation with PMA plus ionomycin. Bars represent mean values ± SE obtained from six donors. (D) Representative flow cytometric analysis of cytokine production by CD4+CD161+ (red plots) and CD4+CD161− (black plots) T cells after 1 wk (left) or 2 wk (right) of in vitro expansion. p-values refer to the comparison between cultures performed in the presence of the indicated cytokines versus those performed in the presence of medium alone. Percentages of gated cells are shown.
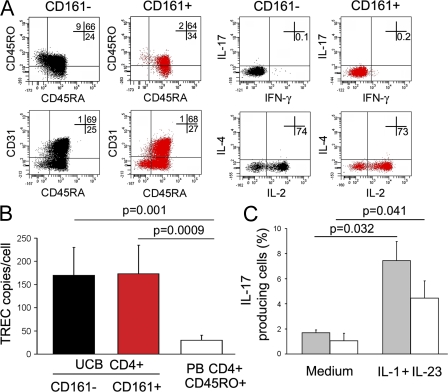
UCB CD161+CD4+ T cells that differentiate into Th17 are naive T cells. (A) Representative flow cytometric analysis of CD45RA, CD45RO, and CD31 (left) and cytokine production after stimulation with PMA plus ionomycin (right) by freshly isolated CD161+ (red plots) and CD161− (black plots) UCB CD4+ T cells. Percentages of gated cells are shown. (B) TREC analysis was performed by quantitative PCR on freshly isolated CD4+CD161+ (red bar) or CD4+CD161− (black bar) UCB CD4+ T cells and on circulating CD45RA−CD45RO+ CD4+ T cells from adult donors (white bar). Bars represent mean values ± SE obtained in three different UCB or PB adult donors. (C) UCB CD4+ T cells were depleted of CD45RO+ cells (including double-positive CD45RA+CD45RO+ cells) by FACS using an anti-CD45RO–APC mAb. The fraction containing only CD45RA+CD45RO− (gray bars) and the fraction containing the remaining CD45RO+ cells (white bars) were activated with anti-CD3/CD28 mAb in the absence (medium) or presence of IL-1β plus IL-23. Bars represent mean values ± SE obtained in three different UCB donors.
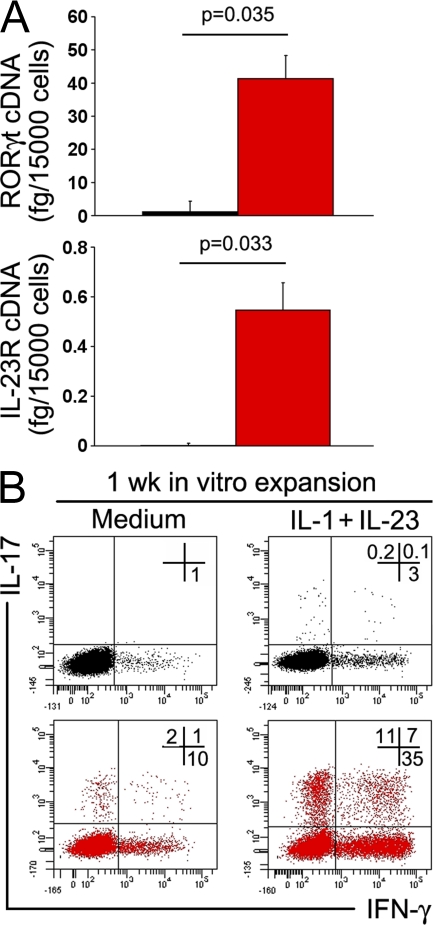
CD161+ but not CD161− thymocytes constitutively express RORγt and IL-23R and can be induced to differentiate to Th17 cells. (A) RORγt and IL-23R mRNA levels detected in CD161− (black bars) and CD161+ (red bars) cells sorted from single-positive CD4+CD8− human thymocyte suspensions. Bars represent mean values + SE obtained in three different donors. (B) Representative flow cytometric analysis of IL-17 and IFN-γ production by CD4+CD161+ (red plots) and CD4+CD161− (black plots) thymocytes after 1 wk of in vitro expansion with anti-CD3/CD28 mAb in the absence (medium) or presence of IL-1β plus IL-23. Comparable results were obtained with CD161− and CD161+ thymocytes from the other two postnatal human thymuses. Percentages of gated cells are shown.
References
-
- Abbas, A.K., K.M. Murphy, and A. Sher. 1996. Functional diversity of helper T lymphocytes. Nature. 383:787–793. - PubMed
-
- Romagnani, S. 1997. The Th1/Th2 paradigm. Immunol. Today. 18:263–266. - PubMed
-
- Rengarajan, J., S.J. Szabo, and L.H. Glimcher. 2000. Transcriptional regulation of Th1/Th2 polarization. Immunol. Today. 21:479–483. - PubMed
-
- Aggarwal, S., N. Ghilardi, M.H. Xie, F.J. de Sauvage, and A.L. Gurney. 2003. Interleukin-23 promotes a distinct CD4 T cell activation state characterized by the production of interleukin-17. J. Biol. Chem. 278:1910–1914. - PubMed
-
- Harrington, L.E., R.D. Hatton, P.R. Mangan, H. Turner, T.L. Murphy, K.M. Murphy, and C.T. Weaver. 2005. Interleukin 17-producing CD4+ effector T cells develop via lineage distinct from the T helper type 1 and 2 lineages. Nat. Immunol. 6:1123–1132. - PubMed
Publication types
MeSH terms
Substances
LinkOut - more resources
Full Text Sources
Other Literature Sources
Molecular Biology Databases
Research Materials
