. 2008 Aug;132(2):279-94.
doi: 10.1085/jgp.200810003.

ACTH inhibits bTREK-1 K+ channels through multiple cAMP-dependent signaling pathways

Affiliations

ACTH inhibits bTREK-1 K+ channels through multiple cAMP-dependent signaling pathways

Haiyan Liu et al. J Gen Physiol. 2008 Aug.

Abstract

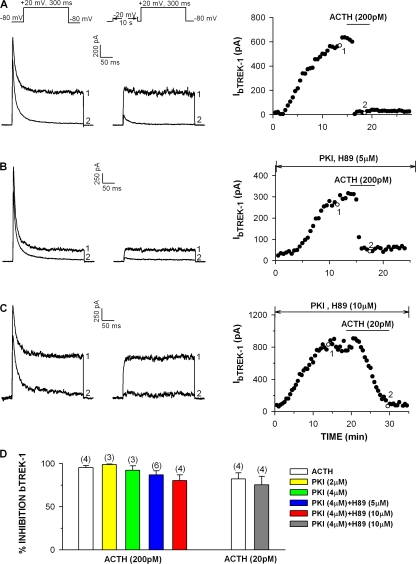
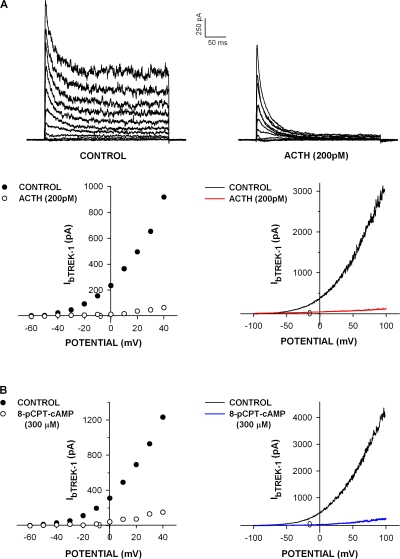
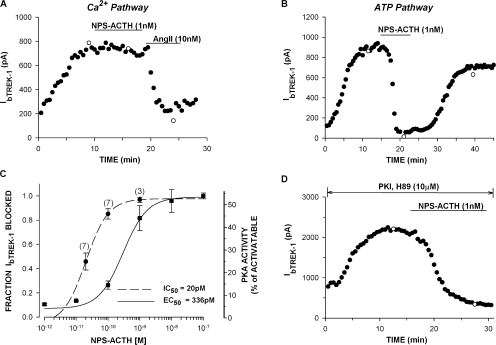
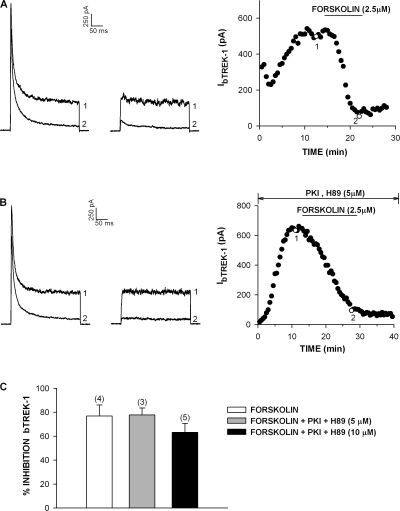
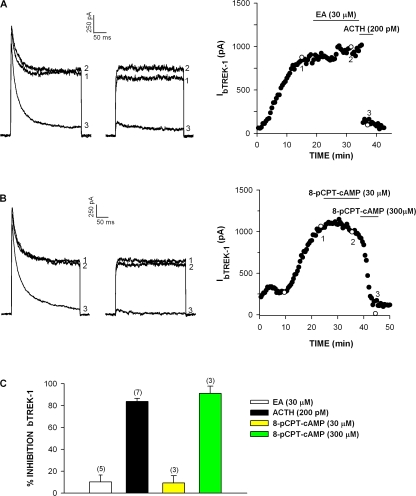
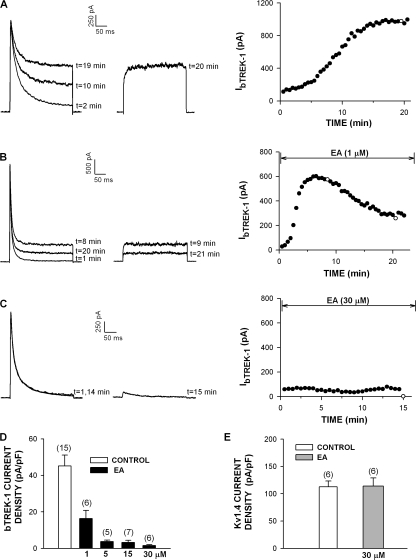
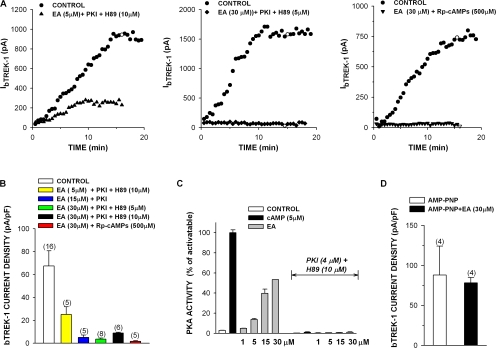
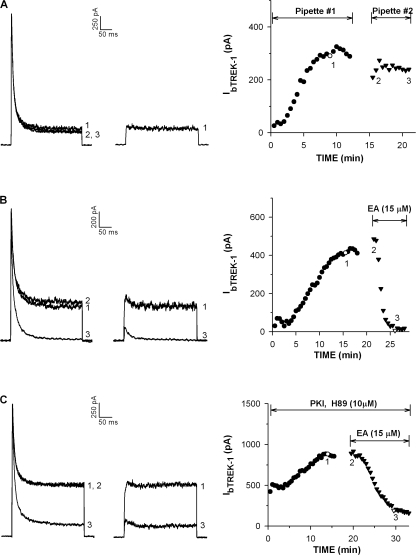
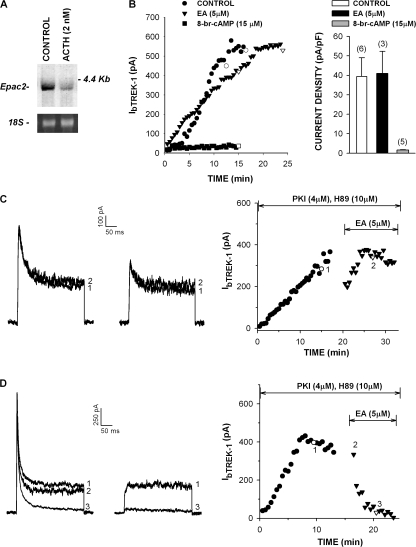
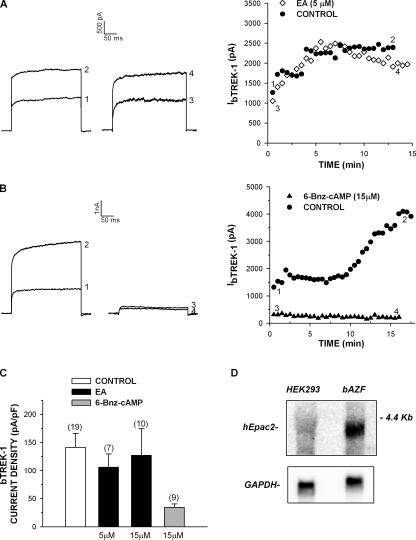
Bovine adrenal zona fasciculata (AZF) cells express bTREK-1 K(+) channels that set the resting membrane potential and function pivotally in the physiology of cortisol secretion. Inhibition of these K(+) channels by adrenocorticotropic hormone (ACTH) or cAMP is coupled to depolarization and Ca(2+) entry. The mechanism of ACTH and cAMP-mediated inhibition of bTREK-1 was explored in whole cell patch clamp recordings from AZF cells. Inhibition of bTREK-1 by ACTH and forskolin was not affected by the addition of both H-89 and PKI (6-22) amide to the pipette solution at concentrations that completely blocked activation of cAMP-dependent protein kinase (PKA) in these cells. The ACTH derivative, O-nitrophenyl, sulfenyl-adrenocorticotropin (NPS-ACTH), at concentrations that produced little or no activation of PKA, inhibited bTREK-1 by a Ca(2+)-independent mechanism. Northern blot analysis showed that bovine AZF cells robustly express mRNA for Epac2, a guanine nucleotide exchange protein activated by cAMP. The selective Epac activator, 8-pCPT-2'-O-Me-cAMP, applied intracellularly through the patch pipette, inhibited bTREK-1 (IC(50) = 0.63 microM) at concentrations that did not activate PKA. Inhibition by this agent was unaffected by PKA inhibitors, including RpcAMPS, but was eliminated in the absence of hydrolyzable ATP. Culturing AZF cells in the presence of ACTH markedly reduced the expression of Epac2 mRNA. 8-pCPT-2'-O-Me-cAMP failed to inhibit bTREK-1 current in AZF cells that had been treated with ACTH for 3-4 d while inhibition by 8-br-cAMP was not affected. 8-pCPT-2'-O-Me-cAMP failed to inhibit bTREK-1 expressed in HEK293 cells, which express little or no Epac2. These findings demonstrate that, in addition to the well-described PKA-dependent TREK-1 inhibition, ACTH, NPS-ACTH, forskolin, and 8-pCPT-2'-O-Me-cAMP also inhibit these K(+) channels by a PKA-independent signaling pathway. The convergent inhibition of bTREK-1 through parallel PKA- and Epac-dependent mechanisms may provide for failsafe membrane depolarization by ACTH.


Figures

Figure 1.
Figure 1.
Effect of PKA inhibitors on bTREK-1 inhibition by ACTH. Whole cell K+ currents were recorded from AZF cells in response to voltage steps applied from −80 mV at 30-s intervals with or without depolarizing prepulses to −20 mV. Pipettes contained standard solution or the same solution supplemented with PKI(6–22) amide (2 or 4 μM) alone or in combination with H-89 (5 or 10 μM). After bTREK-1 reached a stable maximum, cells were superfused with ACTH (1–24) (200 pM). (A–C) K+ current traces recorded with (right traces) and without (left traces) depolarizing prepulses, and corresponding plot of bTREK-1 amplitudes with (open circles) and without (closed circles) depolarizing pulses. Numbers on traces correspond to those on plots. (D) Summary of experiments as in A–C. Bars indicate mean ± SEM of bTREK-1 inhibition by 20 or 200 pM ACTH with or without PKA inhibitors as indicated.
Figure 2.
Figure 2.
bTREK-1 inhibition by ACTH and 8-pCPT-cAMP is voltage independent. bTREK-1 was permitted to grow to a stable maximum before whole cell K+ currents were activated in response to voltage steps or voltage ramps before and after superfusion of ACTH or 8-pCPT-cAMP. Voltage steps were applied at 30-s intervals in 10-mV increments from a holding potential of −80 mV to test potentials from −60 to +40 mV. Voltage ramps were applied at 100 mV/s to potentials between +100 and −100 mV from a holding potential of 0 mV. (A) Effect of ACTH: K+ currents were recorded in response to voltage steps or voltage ramps before and after steady-state block by ACTH (200 pM). Top: current traces in response to voltage steps before and after ACTH. Bottom left: bTREK-1 amplitudes plotted against test potential before (closed circles) and after (open circles) ACTH. Bottom right: bTREK-1 current traces in response to ramp voltages before and after ACTH. (B, left) bTREK-1 amplitudes plotted against test potential in control saline (closed circles) and after 8-pCPT-cAMP (open circles). (B, right) bTREK-1 current traces in response to ramp voltages before and after 8-pCPT-cAMP.
Figure 3.
Figure 3.
Inhibition of bTREK-1 by NPS-ACTH is Ca2+ and PKA independent. The inhibition of bTREK-1 in bovine AZF cells by NPS-ACTH was measured in whole cell patch clamp recordings using pipette solutions that permitted or blocked activation of Ca2+, ATP, or PKA-dependent signaling. K+ currents were recorded at 30-s intervals in response to voltage steps to +20 mV from a holding potential of −80 mV. After currents reached a stable maximum, cells were superfused with NPS-ACTH. (A and B) Effect of NPS-ACTH on bTREK-1 through Ca2+- and ATP hydrolysis–dependent pathways. bTREK-1 current amplitudes with (open circles) and without (closed circles) depolarizing prepulses are plotted against time. Pipette solutions contained (A) 2 mM UTP, 0.5 mM EGTA, (B) 5 mM MgATP, 11 mM BAPTA. NPS-ACTH and AngII were superfused at indicated times. (C) Concentration dependence of bTREK-1 inhibition and PKA activation by NPS-ACTH were measured in AZF cells and cell, respectively. Data were fit with an equation of the form (dotted line) I/IMAX = 1/[1 + (X/IC50)B], where X is the NPS-ACTH concentration, and B is the Hill coefficient. IC50 is the concentration that reduces bTREK-1 by 50%. Values are mean ± SEM of indicated number of determinations, (solid line) PKA activity = 1/[1+(X/EC50)B], where X is the NPS-ACTH concentration, and B is the Hill coefficient. EC50 is the concentration that produces 1/2 of the maximum response. (D) Effect of PKA inhibitors on NPS-ACTH inhibition of bTREK-1. bTREK-1 current amplitudes are plotted against time. Pipette solution contained PKI(6–22)amide (4 μM) and H-89 (10 μM).
Figure 4.
Figure 4.
Effect of PKA inhibitors on bTREK-1 inhibition by forskolin. Whole cell K+ currents were recorded from AZF cells in response to voltage steps applied from −80 mV at 30-s intervals with or without 10-s depolarizing prepulses to −20 mV. Patch pipettes contained standard solution or the same solution supplemented with PKI(6–22) amide (4 μM) alone or in combination with H-89 (5 or 10 μM). After bTREK-1 current reached a stable maximum, cells were superfused with forskolin (2.5 μM). (A and B) K+ current traces recorded with (right traces) and without (left traces) prepulses, and corresponding plot of bTREK-1 amplitudes with (open circles) or without (closed circles) depolarizing pulses. Numbers on traces correspond to those on plots. (C) Summary of experiments as in A and B. Bars indicate mean ± SEM of bTREK-1 inhibition by forskolin (2.5 μM) with or without PKA inhibitors, as indicated.
Figure 5.
Figure 5.
Effect of 8-pCPT-cAMP on bTREK-1 currents in perforated patch recordings. (A and B) Perforated patch recordings: whole cell K+ currents were recorded in the nystatin perforated patch configuration in response to voltage steps applied at 30-s intervals from a holding potential of −80 to +20 mV with (right traces) or without (left traces) depolarizing prepulses. After bTREK-1 reached a stable amplitude, cells were superfused with 8-pCPT-2′-O-Me-cAMP (designated EA for Epac activator) (30 μM), ACTH (200 pM), or 8-pCPT-cAMP (30 or 300 μM), as indicated. Numbers on current traces correspond to those on plot at right. (C) Summary of experiments as in A and B. Bars indicate mean ± SEM of indicated number of determinations.
Figure 6.
Figure 6.
Concentration-dependent inhibition of bTREK-1 by 8-pCPT-2′-O-Me-cAMP. K+ currents were recorded from AZF cells with standard pipette solution or the same solution supplemented with 8-pCPT-2′-O-Me-cAMP (EA) at concentrations from 1 to 30 μM. Currents were recorded in response to voltage steps to +20 mV applied at 30-s intervals from a holding potential of −80 mV with and without depolarizing prepulses. (A–C) Time-dependent increase in bTREK-1 and inhibition by 8-pCPT-2′-O-Me-cAMP (EA). Current traces recorded with (right) and without (left) depolarizing prepulses at indicated times. bTREK-1 amplitudes are plotted at right. Open circles indicate traces recorded with depolarizing prepulse. (D) Summary of experiments as in A–C. Bars indicate bTREK-1 current density in pA/pF expressed as the mean ± SEM of the indicated number of determinations. (E) Effect of 8-pCPT-2′-O-Me-cAMP (EA) on Kv1.4 current. Bars indicate Kv1.4 current density in pA/pF expressed as the mean ± SEM of the indicated number of determinations in control saline and in the presence of 8-pCPT-2′-O-Me-cAMP (30 μM) (EA).
Figure 7.
Figure 7.
bTREK-1 inhibition by 8-pCPT-2′-O-Me-cAMP is independent of PKA. (A–C) Whole cell K+ currents were recorded in response to voltage steps applied at 30-s intervals from −80 to +20 mV with or without depolarizing prepulses. Pipettes contained standard solution or the same solution supplemented with 8-pCPT-2′-O-Me-cAMP (EA), either alone or in combination with PKA inhibitors H-89 (10 μM), PKI(6–22) amide (4 μM), and Rp-cAMPS (500 μM), as indicated. When pipettes contained PKA inhibitors H-89 and PKI(6–22), cells were also pretreated for 30 min with H-89 (10 μM) and myristolated PKI(14–22) peptide (4 μM) before initiating recording. (A) Plots of bTREK-1 amplitude against time with pipettes containing indicated solutions. (B) Summary of experiments as in A. Bars indicate bTREK-1 current density in pA/pF expressed as the mean ± SEM of the indicated number of determinations. (C) Effect of 8-pCPT-2′-O-Me-cAMP (EA) and PKA inhibitors on PKA activity in AZF cell lysates: PKA activity was determined in cell lysates after incubating AZF cells either without (untreated) or with PKA inhibitors for 30 min. PKA activity in lysates from untreated cells was measured after 5 min with no further addition (control) or after addition of cAMP (5 μM) or 8-pCPT-2′-O-Me-cAMP (1–30 μM) (EA). PKA activity in lysates from PKA inhibitor–treated cells was measured after 5 min incubation with cAMP (5 μM) or 8-pCPT-2′-O-Me-cAMP (1–30 μM) (EA) and the PKA inhibitors as indicated. PKA activity is expressed as % of that activatable by 5 μM cAMP in control lysates. (D) Effect of AMP-PNP on 8-pCPT-2′-O-Me-cAMP inhibition of bTREK-1 current. bTREK-1 current was measured at 30-s intervals using patch pipettes containing AMP-PNP (2 mM) in place of ATP, or this same solution plus 8-pCPT-2′-O-Me-cAMP (30 μM) (EA). Bars represent mean ± SEM of maximum current density for the indicated number of determinations.
Figure 8.
Figure 8.
Inhibition of bTREK-1 by 8-pCPT-2′-O-Me-cAMP in twice-patched cells. Whole cell K+ currents were recorded in response to voltage steps to +20 mV applied at 30-s intervals from −80 mV, with or without depolarizing prepulses. Cells were sequentially patched with two pipettes containing standard solution, or the same solution supplemented with PKI(6–22) amide (4 μM), H-89 (10 μM), or 8-pCPT-2′-O-Me-cAMP (EA) as indicated. When bTREK-1 reached a stable maximum, the first pipette was withdrawn and the cell patched again with the second pipette. (A–C) Current traces and corresponding plots of bTREK-1 amplitude against time for cells patch clamped with pipettes containing the additions indicated. Closed circles represent pipette #1, closed triangles, pipette #2. Numbers on traces at left correspond to those on plot at right. Break in graph denotes time required to change patch pipettes.
Figure 9.
Figure 9.
Effect of suppression of Epac2 expression on bTREK-1 inhibition by 8-pCPT-2′-O-Me-cAMP and 8-br-cAMP. (A) Northern blot analysis of ACTH inhibition of Epac2 mRNA expression. AZF cells were cultured either without (control) or with ACTH (2nM). mRNA was isolated after 48 h and analyzed as described in Materials and methods. (B) 8-pCPT-2′-O-Me-cAMP and bTREK-1 expression in ACTH-treated cells. AZF cells were exposed to ACTH (10 nM) for 72–96 h before patch clamping with pipettes containing PKI amide (6–22) (4 μM) and H89 (10 μM) (control), this same solution supplemented with 8-pCPT-2′-O-Me-cAMP (5 μM) (EA), or a solution containing 8-br-cAMP (15 μM). bTREK-1 current amplitudes are plotted against time. Bar graphs: summary of bTREK-1 maximum current densities. Values are mean ± SEM of indicated number of determinations. (C and D) Effect of ACTH treatment on bTREK-1 inhibition by 8-pCPT-2′-O-Me-cAMP in twice-patched cells. AZF cells were cultured in serum-supplemented media with (C) or without (D) 10 nM ACTH for 72–96 h before sequentially recording K+ currents with pipettes containing PKI amide (6–22) (4 μM) plus H89 (10 μM) and then these two agents plus 8-pCPT-2′-O-Me-cAMP (EA) (5 μM). K+ current traces recorded with (right traces) and without (left traces) depolarizing prepulses. Numbers on traces correspond to those on plots of bTREK-1 amplitude at right.
Figure 10.
Figure 10.
6-Bnz-cAMP but not 8-pCPT-2′-O-Me-cAMP inhibits bTREK-1 channels expressed in HEK293 cells. Whole cell K+ currents were recorded from HEK293 cells that had been transiently transfected with pCR3.1 uni-bTREK-1 cDNA. K+ currents were activated by voltage steps to +20 mV, applied at 30-s intervals from a holding potential of −80 mV. Patch pipettes contained control saline or this same solution supplemented with 8-pCPT-2′-O-Me-cAMP (5 or 15 μM) (EA) or 6-Bnz-cAMP (15 μM). (A and B) Effect of 8-pCPT-2′-O-Me-cAMP (EA) and 6-Bnz-cAMP on bTREK-1 current. bTREK-1 current traces and associated time-dependent plots of current amplitudes. Numbers on traces correspond to those on plots at right. (C) Summary of experiments as shown in A and B. Bars indicate maximum bTREK-1 current density expressed as pA/pF. Values are mean ± SEM for indicated number of determinations. (D) Northern blot analysis of Epac2 in bovine AZF and HEK293 cells. Lanes contained 7 μg of poly(A)+ RNA from the indicated cells. Hybridization with hEpac2 probe was performed as described in Materials and methods.

Similar articles

Cited by

References

    1. Awad, J.A., R.A. Johnson, K.H. Jakobs, and G. Schultz. 1983. Interactions of forskolin and adenylate cyclase. Effects on substrate kinetics and protection against inactivation by heat and N-ethylmaleimide. J. Biol. Chem. 258:2960–2965. - PubMed
    1. Bockenhauer, D., N. Zilberberg, and S.A. Goldstein. 2001. KCNK2: reversible conversion of a hippocampal potassium leak into a voltage-dependent channel. Nat. Neurosci. 4:486–491. - PubMed
    1. Bos, J.L. 2003. Epac: a new cAMP target and new avenues in cAMP research. Nat. Rev. Mol. Cell Biol. 4:733–738. - PubMed
    1. Brooks, S.P., and K.B. Storey. 1992. Bound and determined: a computer program for making buffers of defined ion concentrations. Anal. Biochem. 201:119–126. - PubMed
    1. Buckley, D.I., and J. Ramachandran. 1981. Characterization of corticotropin receptors on adrenocortical cells. Proc. Natl. Acad. Sci. USA. 78:7431–7435. - PMC - PubMed

Publication types

MeSH terms

Substances