Comparative Study
. 2008 Aug 5;105(31):10670-5.
doi: 10.1073/pnas.0804612105. Epub 2008 Jul 28.

Lensless high-resolution on-chip optofluidic microscopes for Caenorhabditis elegans and cell imaging

Affiliations
Comparative Study

Lensless high-resolution on-chip optofluidic microscopes for Caenorhabditis elegans and cell imaging

Xiquan Cui et al. Proc Natl Acad Sci U S A. .

Abstract

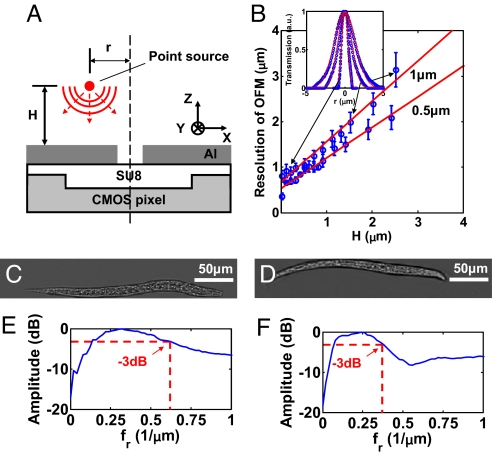
Low-cost and high-resolution on-chip microscopes are vital for reducing cost and improving efficiency for modern biomedicine and bioscience. Despite the needs, the conventional microscope design has proven difficult to miniaturize. Here, we report the implementation and application of two high-resolution (approximately 0.9 microm for the first and approximately 0.8 microm for the second), lensless, and fully on-chip microscopes based on the optofluidic microscopy (OFM) method. These systems abandon the conventional microscope design, which requires expensive lenses and large space to magnify images, and instead utilizes microfluidic flow to deliver specimens across array(s) of micrometer-size apertures defined on a metal-coated CMOS sensor to generate direct projection images. The first system utilizes a gravity-driven microfluidic flow for sample scanning and is suited for imaging elongate objects, such as Caenorhabditis elegans; and the second system employs an electrokinetic drive for flow control and is suited for imaging cells and other spherical/ellipsoidal objects. As a demonstration of the OFM for bioscience research, we show that the prototypes can be used to perform automated phenotype characterization of different Caenorhabditis elegans mutant strains, and to image spores and single cellular entities. The optofluidic microscope design, readily fabricable with existing semiconductor and microfluidic technologies, offers low-cost and highly compact imaging solutions. More functionalities, such as on-chip phase and fluorescence imaging, can also be readily adapted into OFM systems. We anticipate that the OFM can significantly address a range of biomedical and bioscience needs, and engender new microscope applications.


Conflict of interest statement

The authors declare no conflict of interest.

Figures

Fig. 1.
Fig. 1.
Comparison of on-chip imaging schemes. (A) Direct projection imaging scheme. By placing the specimen directly on top of the sensor grid, we can obtain a projection image with resolution equal to the sensor pixel size. (B) By placing the specimen on a grid of apertures, we can obtain a sparse image. However, for the same grid density, the obtained image will not be much improved over that of A. (C) By raster-scanning the specimen over the aperture grid, we can obtain a “filled-in” image. In this case, the image resolution is limited by the aperture size. Grid density is no longer a factor in resolution consideration. (D) The scanning scheme can be simplified into a single-pass flow of the specimen across the grid by orientating the grid at a small angle (θ) with respect to the flow direction (x axis). (E) The aperture grid can be simplified by substitution with a long linear aperture array. This scheme is the basis for the optofluidic microscopy method.
Fig. 2.
Fig. 2.
OFM prototype. (A) schematic of the device (top view). The OFM apertures (white circles) are defined on the Al (gray) coated 2D CMOS image sensor (light gray dashed grid) and span across the whole microfluidic channel (blue lines). (B) The actual device compared with a U.S. quarter. (C) Upright operation mode. (D) Flow diagram of the OFM operation. Two OFM images of the same C. elegans are acquired by the two OFM arrays, respectively (red arrows). If the image correlation is <50%, the image pair is rejected. Otherwise, the area and the length of the worms are measured automatically by evaluating the contour (green dashed line) and the midline (yellow dashed line). (E) Cross-section of the fabrication of an electrokinetically driven OFM device.
Fig. 3.
Fig. 3.
Images of wild-type C. elegans L1 larvae. (A) Duplicate OFM images acquired by the two OFM arrays for the same C. elegans. (B) Direct projection image on a CMOS sensor with 9.9-μm pixel size. (C) Conventional microscope image acquired with a ×20 objective.
Fig. 4.
Fig. 4.
Phenotype characterization of C. elegans L1 larvae. (A–C) Typical OFM images of wild-type, sma-3, and dpy-7 worms, respectively. (D and E) The length (D) and effective width (E) of wild-type, sma-3, and dpy-7 worms, respectively (color-coded). The columns represent the mean values in the population; the hatched areas correspond to the confidence intervals of the mean values; and the error bars are the standard deviations indicating the variation between individuals in the population. Twenty-five worms were evaluated for each phenotype.
Fig. 5.
Fig. 5.
Cell and microsphere images. (A–E) Images taken from the on-chip OFM driven by dc electrokinetics of Chlamydomonas (A and B), mulberry pollen (C and D), and a 10-μm polystyrene microsphere. (F–J) Images taken from a conventional light transmission microscope with a ×20 objective of Chlamydomonas (F and G), mulberry pollen (H and I), and a 10-μm polystyrene microsphere (J). (Scale bars: 10 μm.)
Fig. 6.
Fig. 6.
Resolution of the OFM prototype. (A) Schematic of the PSF measurement. (B) Resolution of the prototype at various heights H above a 0.5- and a 1-μm-diameter aperture under Sparrow's criterion. (Inset) Representative OFM PSF plots at H = 0.1, 1.5, and 2.5 μm for the 1-μm-diameter aperture. (C and D) OFM images of wild-type C. elegans L1 larvae in a 15- and 25-μm-tall microfluidic channels, respectively. (E and F) Radial frequency spectra of OFM images in C and D, respectively. The −3-dB bandwidths (dashed red lines) are at 0.62 and 0.38 μm−1, respectively.

Similar articles

Cited by

References

    1. Whitesides GM. The origins and the future of microfluidics. Nature. 2006;442:368–373. - PubMed
    1. El-Ali J, Sorger PK, Jensen KF. Cells on chips. Nature. 2006;442:403–411. - PubMed
    1. Garcia-Sucerquia J, et al. Digital in-line holographic microscopy. Appl Opt. 2006;45:836–850. - PubMed
    1. Lange D, Storment CW, Conley CA, Kovacs GTA. A microfluidic shadow imaging system for the study of the nematode Caenorhabditis elegans in space. Sensors Actuators B. 2005;107:904–914.
    1. Ozcan A, Demirci U. Ultra wide-field lens-free monitoring of cells on-chip. Lab Chip. 2008;8:98–106. - PubMed

Publication types

MeSH terms