. 2008 Dec 5;147B(8):1379-86.
doi: 10.1002/ajmg.b.30836.

Non-random error in genotype calling procedures: implications for family-based and case-control genome-wide association studies

Affiliations

Non-random error in genotype calling procedures: implications for family-based and case-control genome-wide association studies

Richard J L Anney et al. Am J Med Genet B Neuropsychiatr Genet. .

Abstract

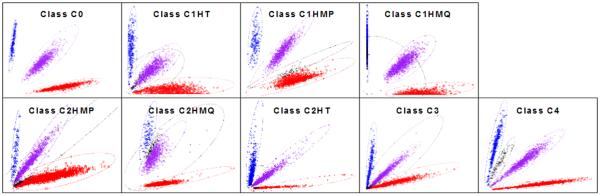
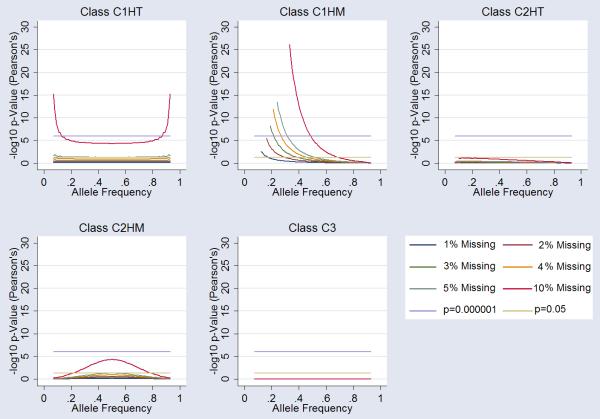
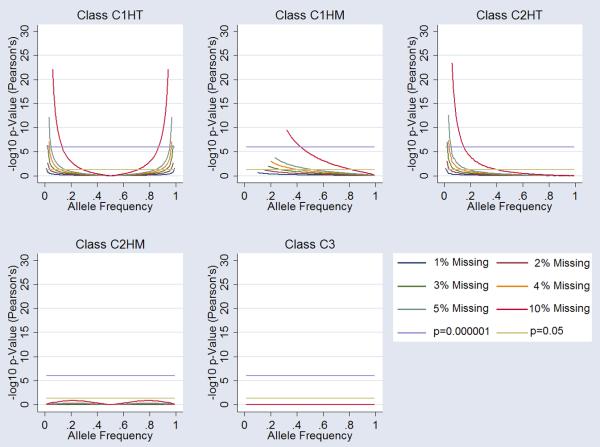
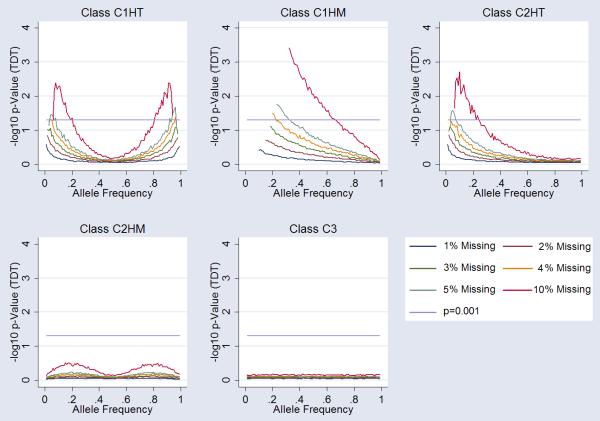
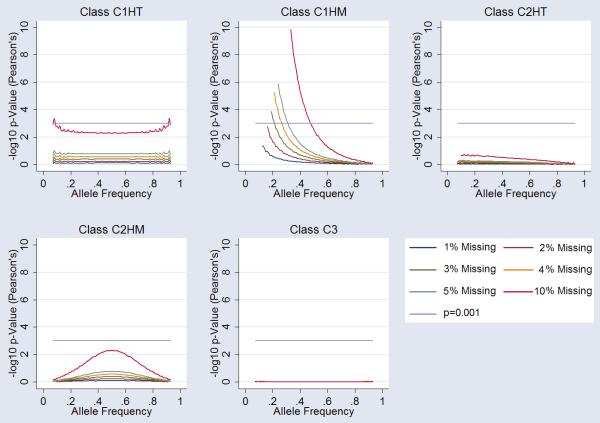
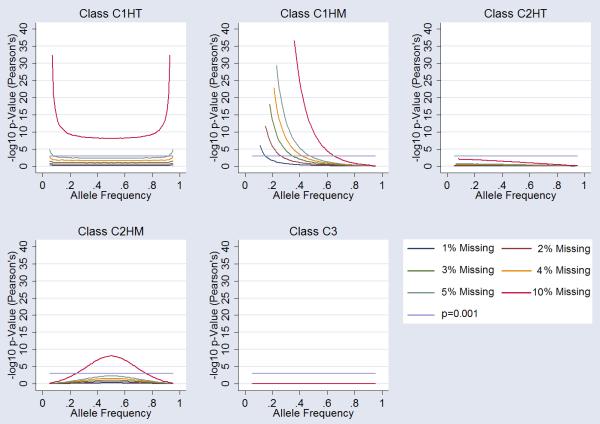
The considerable data-handling requirements for genome wide association studies (GWAS) prohibit individual calling of genotypes and create a reliance on sophisticated "genotype-calling algorithms." Despite their obvious utility, the current genotyping platforms and calling-algorithms used are not without their limitations. Specifically, some genotypes are not called due to the ambiguity of the data. Any bias in the missing data could create spurious results. Using data from the Genetic Analysis Information Network (GAIN) we observed that missing genotypes are not randomly distributed throughout the homozygous and heterozygous groups. Using simulation, we examined whether the level and type of missingness observed might influence deviation from the null-hypothesis under common case-control and family-based statistical approaches. Under a case-control model, where missingness is present in a case group but not the controls, we observed bias giving rise to genome-wide significant type-I error for missingness as low as 3%. The family-based association simulations show close to nominal type-I error at 4% genotype missingness. These findings have important implications to study design, quality-control procedures and reporting of findings in GWAS.


Figures

Figure 1
Figure 1
Cluster-Plot Classes. Clusters defined according to homozygous call of the minor-allele (blue), heterozygous (purple) and homozygous major-allele (red). Missing genotypes are shown as a black cluster. Specific cluster bias is coded as follows; Class 1 influencing one cluster of homozygous calls-only (C1HM), Class 1 influencing the one cluster of heterozygous calls-only (C1HT), Class 2 influencing both (two) clusters of homozygous calls-only (C2HM), Class 2 influencing one homozygous and one heterozygous cluster (C2HT) and Class 3 influencing all three clusters (C3).
Figure 2
Figure 2
Influence of Missingness on Hardy-Weinberg Equilibrium (HWE). Each graph shows the influence on HWE at markers for each class of “missingess”. 1%, 2%,3%, 4%, 5% and 10% missingness is plotted (see legend). Arbitrary genomewide significance is highlighted (p=10−6) alongside nominal significance (p=0.05). Specific cluster bias is coded as follows; Class 1 influencing one cluster of homozygous calls-only (C1HM), Class 1 influencing the one cluster of heterozygous calls-only (C1HT), Class 2 influencing both (two) clusters of homozygous calls-only (C2HM), Class 2 influencing one homozygous and one heterozygous cluster (C2HT) and Class 3 influencing all three clusters (C3).
Figure 3
Figure 3
Influence of Missingness on Allelic Association. Each graph shows the influence on alleleic association at markers for each class of “missingess”. 1%, 2%,3%, 4%, 5% and 10% missingness is plotted (see legend). Arbitrary genomewide significance is highlighted (p=10−6) alongside nominal significance (p=0.05). Specific cluster bias is coded as follows; Class 1 influencing one cluster of homozygous calls-only (C1HM), Class 1 influencing the one cluster of heterozygous calls-only (C1HT), Class 2 influencing both (two) clusters of homozygous calls-only (C2HM), Class 2 influencing one homozygous and one heterozygous cluster (C2HT) and Class 3 influencing all three clusters (C3).
Figure 4
Figure 4
Influence of Missingness on Transmission Equilibrium. Each graph shows the influence on the transmission disequilibrium test (TDT) at markers for each class of “missingess”. 1%, 2%,3%, 4%, 5% and 10% missingness is plotted (see legend). Arbitrary genomewide significance is highlighted (p=10−6) alongside nominal significance (p=0.05). Specific cluster bias is coded as follows; Class 1 influencing one cluster of homozygous calls-only (C1HM), Class 1 influencing the one cluster of heterozygous calls-only (C1HT), Class 2 influencing both (two) clusters of homozygous calls-only (C2HM), Class 2 influencing one homozygous and one heterozygous cluster (C2HT) and Class 3 influencing all three clusters (C3).
Figure 5
Figure 5
Influence of Missingness on Hardy Weinberg Equilibrium (HWE) in 1500 cases of a 3000 individual case-control study. Each graph shows the influence on HWE (Pearson's Chi-square) at markers for each class of “missingess”. 1%, 2%,3%, 4%, 5% and 10% missingness is plotted (see legend). HWE thresholds of p=10−3 are highlighted. Specific cluster bias is coded as follows; Class 1 influencing one cluster of homozygous calls-only (C1HM), Class 1 influencing the one cluster of heterozygous calls-only (C1HT), Class 2 influencing both (two) clusters of homozygous calls-only (C2HM), Class 2 influencing one homozygous and one heterozygous cluster (C2HT) and Class 3 influencing all three clusters (C3).
Figure 6
Figure 6
Influence of Missingness on Hardy Weinberg Equilibrium (HWE) in 3000 individuals of a 1000 parent-parent-child trio study. Each graph shows the influence on HWE (Pearson's Chi-square) at markers for each class of “missingess”. 1%, 2%,3%, 4%, 5% and 10% missingness is plotted (see legend). HWE thresholds of p=10−3 are highlighted. Specific cluster bias is coded as follows; Class 1 influencing one cluster of homozygous calls-only (C1HM), Class 1 influencing the one cluster of heterozygous calls-only (C1HT), Class 2 influencing both (two) clusters of homozygous calls-only (C2HM), Class 2 influencing one homozygous and one heterozygous cluster (C2HT) and Class 3 influencing all three clusters (C3).

References

    1. Affymetrix BRLMM-P: a Genotype Calling Method for the SNP 5.0 Array Affymetrix Whitepaper. 2006. http://www.affymetix.com.
    1. Affymetrix Birdseed Algorithm. 2007. http://www.affymetix.com.
    1. Altshuler D, Daly M. Guilt beyond a reasonable doubt. Nature Genetics. 2007;39(7):813–815. - PubMed
    1. Carvalho B, Bengtsson H, Speed TP, Irizarry RA. Exploration, normalization, and genotype calls of high-density oligonucleotide SNP array data. Biostatistics. 2007;8(2):485–99. - PubMed
    1. Marchini J, Howie B, Myers S, McVean G, Donnelly P. A new multipoint method for genome-wide association studies by imputation of genotypes. Nat Genet. 2007;39(7):906–13. - PubMed

Publication types

MeSH terms

Substances