. 2008 Jul 29:9:354.
doi: 10.1186/1471-2164-9-354.

Expression patterns of transcribed human endogenous retrovirus HERV-K(HML-2) loci in human tissues and the need for a HERV Transcriptome Project

Affiliations

Expression patterns of transcribed human endogenous retrovirus HERV-K(HML-2) loci in human tissues and the need for a HERV Transcriptome Project

Aline Flockerzi et al. BMC Genomics. .

Abstract

Background: A significant proportion of the human genome is comprised of human endogenous retroviruses (HERVs). HERV transcripts are found in every human tissue. Expression of proviruses of the HERV-K(HML-2) family has been associated with development of human tumors, in particular germ cell tumors (GCT). Very little is known about transcriptional activity of individual HML-2 loci in human tissues, though.

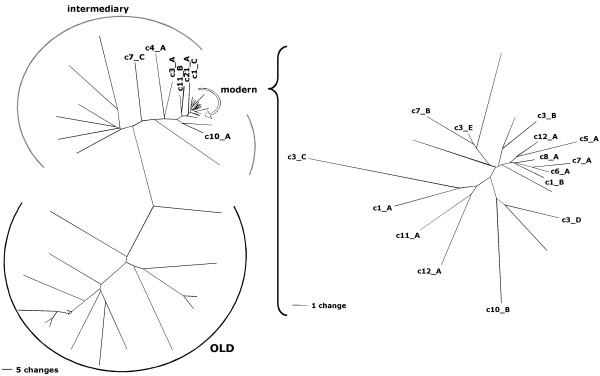
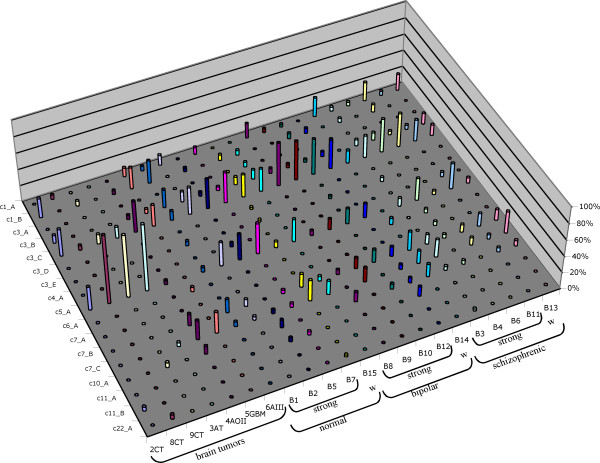
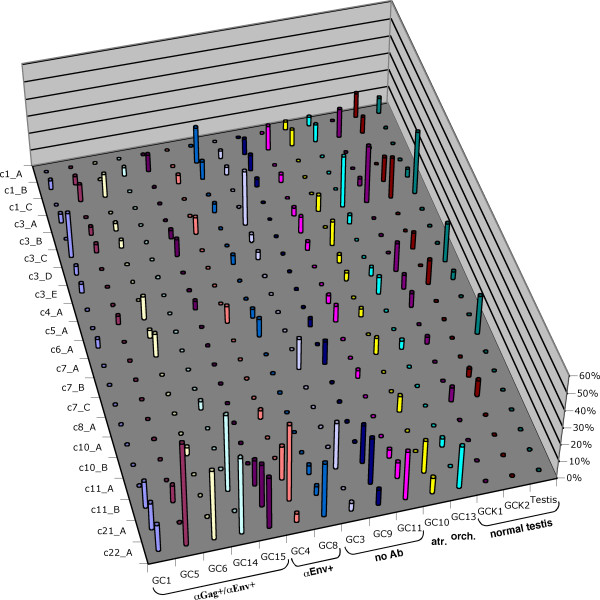
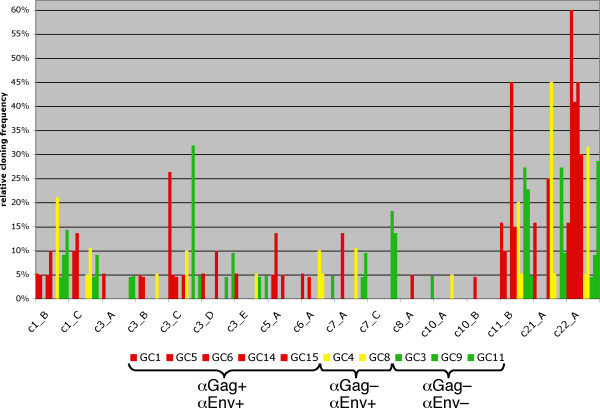
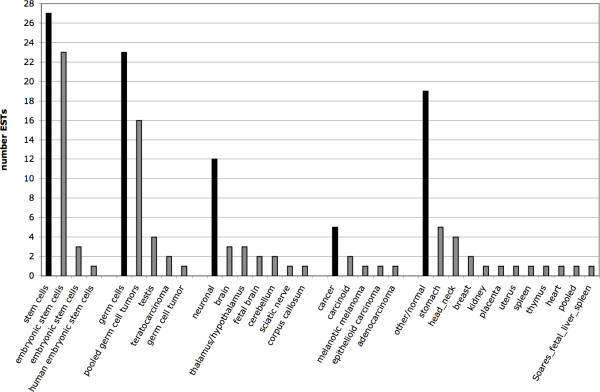
Results: By employing private nucleotide differences between loci, we assigned approximately 1500 HML-2 cDNAs to individual HML-2 loci, identifying, in total, 23 transcriptionally active HML-2 proviruses. Several loci are active in various human tissue types. Transcription levels of some HML-2 loci appear higher than those of other loci. Several HML-2 Rec-encoding loci are expressed in GCT and non-GCT tissues. A provirus on chromosome 22q11.21 appears strongly upregulated in pathologic GCT tissues and may explain high HML-2 Gag protein levels in GCTs. Presence of Gag and Env antibodies in GCT patients is not correlated with activation of individual loci. HML-2 proviruses previously reported capable of forming an infectious HML-2 variant are transcriptionally active in germ cell tissue. Our study furthermore shows that Expressed Sequence Tag (EST) data are insufficient to describe transcriptional activity of HML-2 and other HERV loci in tissues of interest.

Conclusion: Our, to date, largest-scale study reveals in greater detail expression patterns of individual HML-2 loci in human tissues of clinical interest. Moreover, large-scale, specialized studies are indicated to better comprehend transcriptional activity and regulation of HERVs. We thus emphasize the need for a specialized HERV Transcriptome Project.


Figures

Figure 1
Figure 1
Neighbor joining (NJ) trees of HERV-K(HML-2) sequences in the proviral reference sequence dataset for gag-derived cDNAs. The NJ-trees depict absolute numbers of nucleotide differences between the various sequences, excluding indels for pairwise comparisons, thus demonstrating private nucleotide differences between HML-2 loci. The tree on the right depicts a subset of sequences, labeled "modern" in the tree on the left, at higher resolution. Only HML-2 loci having the amplified gag region were included in the tree. The investigated gag region also includes a 96 bp region that distinguishes evolutionarily modern HERV-K(HML-2) from evolutionarily old (HERV-K(OLD)) proviruses. An intermediary group between modern and old proviruses is evident. For better resolution, a separate NJ tree for the modern HML-2 proviruses is shown at the right. For the sake of simplicity, only branches of proviruses identified as transcriptionally active in this study are indicated in the tree, other branches are unlabelled. Scale bars represent 5 nt differences in the left tree and 1 nt difference in the right tree.
Figure 2
Figure 2
Transcriptional activity of HERV-K(HML-2) proviruses in different brain tissues. For each provirus, the relative cloning frequency of gag-derived cDNAs per tissue specimen that were assignable to the particular provirus are given. Only proviruses for which transcripts have been found as cDNA are included. Brain tissue specimens have been grouped in those derived from various types of brain tumors (CT: common type meningiomas; AT: atypical meningioma; AOII: meningioma grade II; GBM: glioblastoma multiforme; AIII: atypical meningioma grade III) and in those from normal, bipolar and schizophrenic patients. Specimens with previously identified stronger (strong) and weaker (w) HML-2-specific signal intensities in microarray experiments (see text) are indicated. See Additional file 1 for more details.
Figure 3
Figure 3
Transcriptional activity of HERV-K(HML-2) proviruses in different germ cell tissues. The various germ cell tissue specimens have been grouped based on presence of Gag and/or Env antibodies in patients (GC1 – GC8), specimens from atrophic and orchitic testis (GC10, GC13) and normal testis (GCK1 – Testis). Relative cloning frequencies for gag-derived cDNAs are given. See Table 1 for Gag, Env and Rec coding capacity of individual loci, and Fig. 2 and Additional file 1 for further details.
Figure 4
Figure 4
No correlation between HML-2 provirus activity and HML-2 Gag and Env antibodies in GCT patients. Relative cloning frequencies of gag-derived cDNAs from various HML-2 loci in malignant and pathologic testicular tissues are given. Only active HML-2 loci have been included. Results for tissue samples (GC1, 5, 6, 14, 15) from patients with antibodies against Gag and Env (αGag+/αEnv+) are shown as red bars. Yellow bars denote results for tissue samples (GC4, 8) from patients with Env but without Gag antibodies (αGag-/αEnv+). Green bars denote results for control tissue samples (GC3, 9, 11) from patients with neither Gag nor Env antibodies (αGag-/αEnv-). Note that none of the HML-2 loci appears exclusively expressed in all Gag and/or Env antibody-positive samples but not in antibody-negative control samples.
Figure 5
Figure 5
Summary of tissue origins of HERV-K(HML-2)-derived ESTs in the human section of dbEST. Information on tissue origins was compiled from EST sequence entries. Source tissues were combined in appropriate groups. Black bars indicate the total number of ESTs per source tissue group. Grey bars further indicate the number of ESTs from individual source tissues within a source tissue group. Tissue designations are as given in the EST sequence entries. Note that some ESTs lacked information on source tissues.

References

    1. Mayer J, Meese E. Human endogenous retroviruses in the primate lineage and their influence on host genomes. Cytogenet Genome Res. 2005;110:448–456. - PubMed
    1. de Parseval N, Heidmann T. Human endogenous retroviruses: from infectious elements to human genes. Cytogenet Genome Res. 2005;110:318–332. - PubMed
    1. Sverdlov ED. Perpetually mobile footprints of ancient infections in human genome. FEBS Lett. 1998;428:1–6. - PubMed
    1. Gifford R, Kabat P, Martin J, Lynch C, Tristem M. Evolution and distribution of class II-related endogenous retroviruses. J Virol. 2005;79:6478–6486. - PMC - PubMed
    1. Dunn CA, Medstrand P, Mager DL. An endogenous retroviral long terminal repeat is the dominant promoter for human beta1,3-galactosyltransferase 5 in the colon. Proc Natl Acad Sci USA. 2003;100:12841–12846. - PMC - PubMed

Publication types

MeSH terms

Substances