

Climate and land use change impacts on plant distributions in Germany
- PMID: 18664416
- PMCID: PMC2610074
- DOI: 10.1098/rsbl.2008.0231
Climate and land use change impacts on plant distributions in Germany
Abstract
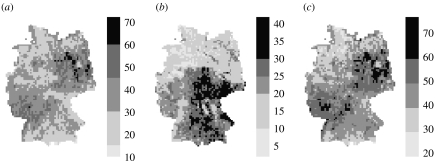
We present niche-based modelling to project the distribution of 845 European plant species for Germany using three different models and three scenarios of climate and land use changes up to 2080. Projected changes suggested large effects over the coming decades, with consequences for the German flora. Even under a moderate scenario (approx. +2.2 degrees C), 15-19% (across models) of the species we studied could be lost locally-averaged from 2,995 grid cells in Germany. Models projected strong spatially varying impacts on the species composition. In particular, the eastern and southwestern parts of Germany were affected by species loss. Scenarios were characterized by an increased number of species occupying small ranges, as evidenced by changes in range-size rarity scores. It is anticipated that species with small ranges will be especially vulnerable to future climate change and other ecological stresses.
Figures

References
-
- Dormann C.F. Promising the future? Global change projections of species distributions. Basic Appl. Ecol. 2007;8:387–397. doi:10.1016/j.baae.2006.11.001 - DOI
-
- European Soil Database (v. 2.0) 2004 European Soil Bureau Network and the European Commission, EUR 19945 EN. See http://eusoils.jrc.it
-
- Heikkinen R.K, Luoto M, Araújo M.B, Virkkala R, Thuiller W, Sykes M.T. Methods and uncertainties in bioclimatic envelope modelling under climate change. Prog. Phys. Geogr. 2006;30:751–777. doi:10.1177/0309133306071957 - DOI
-
- Jalas J, Suominen J. The Committee for Mapping the Flora of Europe and Societas Biologica Fennica Vanamo; Helsinki, Finland: 1972-2004. Atlas Florae Europaeae.
-
- Jetz W, Wilcove D.S, Dobson A.P. Projected impacts of climate and land-use change on the global diversity of birds. PLoS Biol. 2007;5:1211–1219. doi:10.1371/journal.pbio.0050157 - DOI - PMC - PubMed
Publication types
MeSH terms
LinkOut - more resources
Full Text Sources