

Climate and the range dynamics of species with imperfect detection
- PMID: 18664423
- PMCID: PMC2610062
- DOI: 10.1098/rsbl.2008.0051
Climate and the range dynamics of species with imperfect detection
Abstract
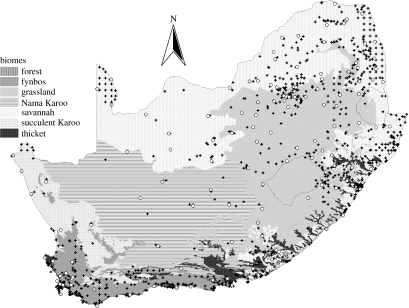
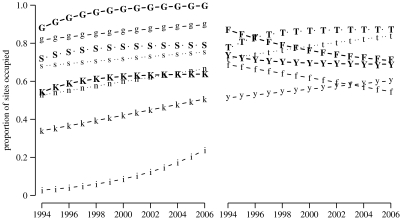
Reliable predictions for species range changes require a mechanistic understanding of range dynamics in relation to environmental variation. One obstacle is that most current models are static and confound occurrence with the probability of detecting a species if it occurs at a site. Here we draw attention to recently developed occupancy models, which can be used to examine colonization and local extinction or changes in occupancy over time. These models further account for detection probabilities, which are likely to vary spatially and temporally in many datasets. Occupancy models require repeated presence/absence surveys, for example checklists used in bird atlas projects. As an example, we examine the recent range expansion of hadeda ibises (Bostrychia hagedash) in South African protected areas. Colonization exceeded local extinction in most biomes, and the probability of occurrence was related to local climate. Extensions of the basic occupancy models can estimate abundance or species richness. Occupancy models are an appealing additional tool for studying species' responses to global change.
Figures
References
-
- Broennimann O, Treier U.A, Müller-Schärer H, Thuiller W, Peterson A.T, Guisan A. Evidence of climatic niche shift during biological invasion. Ecol. Lett. 2007;10:701–709. doi:10.1111/j.1461-0248.2007.01060.x - DOI - PubMed
-
- Burnham K.P, Anderson D.R. 2nd edn. Springer; New York, NY: 2002. Model selection and multimodel inference: a practical information–theoretic approach.
-
- Dorazio R.M, Royle J.A, Söderström B, Glimskär A. Estimating species richness and accumulation by modeling species occurrence and detectability. Ecology. 2006;87:842–854. doi:10.1890/0012-9658(2006)87[842:ESRAAB]2.0.CO;2 - DOI - PubMed
-
- Eraud C, Boutin J.M, Roux D, Faivre B. Spatial dynamics of an invasive bird species assessed using robust design occupancy analysis: the case of the Eurasian collared dove (Streptopelia decaocto) in France. J. Biogeogr. 2007;34:1077–1086. doi:10.1111/j.1365-2699.2006.01673.x - DOI
-
- Gimenez O, Covas R, Brown C.R, Anderson M.D, Brown M.B, Lenormand T. Nonparametric estimation of natural selection on a quantitative trait using mark–recapture data. Evolution. 2006;60:460–466. - PubMed
Publication types
MeSH terms
LinkOut - more resources
Full Text Sources
Research Materials
