. 2008 Sep 26;283(39):26643-61.
doi: 10.1074/jbc.M801071200. Epub 2008 Jul 29.

Acute hypertonicity alters aquaporin-2 trafficking and induces a MAPK-dependent accumulation at the plasma membrane of renal epithelial cells

Affiliations

Acute hypertonicity alters aquaporin-2 trafficking and induces a MAPK-dependent accumulation at the plasma membrane of renal epithelial cells

Udo Hasler et al. J Biol Chem. .

Abstract

The unique phenotype of renal medullary cells allows them to survive and functionally adapt to changes of interstitial osmolality/tonicity. We investigated the effects of acute hypertonic challenge on AQP2 (aquaporin-2) water channel trafficking. In the absence of vasopressin, hypertonicity alone induced rapid (<10 min) plasma membrane accumulation of AQP2 in rat kidney collecting duct principal cells in situ, and in several kidney epithelial lines. Confocal microscopy revealed that AQP2 also accumulated in the trans-Golgi network (TGN) following hypertonic challenge. AQP2 mutants that mimic the Ser(256)-phosphorylated and -nonphosphorylated state accumulated at the cell surface and TGN, respectively. Hypertonicity did not induce a change in cytosolic cAMP concentration, but inhibition of either calmodulin or cAMP-dependent protein kinase A activity blunted the hypertonicity-induced increase of AQP2 cell surface expression. Hypertonicity increased p38, ERK1/2, and JNK MAPK activity. Inhibiting MAPK activity abolished hypertonicity-induced accumulation of AQP2 at the cell surface but did not affect either vasopressin-dependent AQP2 trafficking or hypertonicity-induced AQP2 accumulation in the TGN. Finally, increased AQP2 cell surface expression induced by hypertonicity largely resulted from a reduction in endocytosis but not from an increase in exocytosis. These data indicate that acute hypertonicity profoundly alters AQP2 trafficking and that hypertonicity-induced AQP2 accumulation at the cell surface depends on MAP kinase activity. This may have important implications on adaptational processes governing transcellular water flux and/or cell survival under extreme conditions of hypertonicity.


Figures

FIGURE 1.
FIGURE 1.
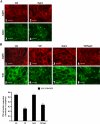
Acute hypertonicity increases AQP2 expression at the cell surface. LLC-AQP2 cells (A–C), mCCDcl1 cells (D–F), and rat kidney slices (G–I) were challenged or not (Ctl) for 30 min with either NaCl-enriched hypertonic (500 mosmol/kg) medium or VP prior to fixation and staining with anti-c-myc (for LLC-AQP2 cells) or anti-AQP2 (for mCCDcl1 cells and kidney slices) antibodies. G–I, AQP2 immunostaining in the proximal inner medulla. Large arrowheads, AQP2 expressed at the apical membrane; small arrowheads, indicate AQP2 expressed at the basal membrane. Bar, 10 μm (A–F) and 5 μm (G–I).
FIGURE 2.
FIGURE 2.
A small increase of extracellular tonicity induces a rapid and reversible accumulation of AQP2 at the cell surface. A, AQP2 expression at the cell surface and cytoplasm was estimated using IPLab software by quantifying the number of pixels contained in an outline enclosing the plasma membrane (highlighted in red) and the cell cytoplasm (highlighted in blue). A representative image of a VP-challenged LLC-AQP2 cell is shown. B and C, mCCDcl1 cells (B, closed bars), LLC-AQP2 cells (B, open bars), and rat kidney slices (C) were challenged or not (Ctl) for 10 or 30 min with NaCl-enriched hypertonic (350–1000 mosmol/kg) medium, mannitol (Man)-enriched hypertonic (500 or 1000 mosmol/kg) medium, urea-enriched hyperosmotic (500 or 1000 mosmol/kg) medium, or VP. In another set of experiments, cells and kidney slices were first challenged with NaCl-enriched hypertonic (500 and 1000 mosmol/kg for cell lines and for kidney slices, respectively) medium for 30 min, after which time the medium was replaced by isotonic medium followed by an additional 30 min of incubation (NaCl wash). Cells were fixed and stained as described for Fig. 1, and AQP2 cell surface expression was determined as described in A and under “Experimental Procedures.” Results are mean ± S.E. (n = 3–5). *, p < 0.05. D, x-z scan analysis of confocal images of LLC-AQP2 and mCCDcl1 cells challenged or not (Ctl) for 30 min with VP or NaCl-enriched hypertonic (500 mosmol/kg) medium. Hypertonicity induced AQP2 (red) to rapidly redistribute toward apical and lateral poles of both cell lines. The plasma membrane was visualized by Alexa Fluor 488-conjugated wheat germ agglutinin (green). AQP2 expression at the cell surface is revealed in yellow. Representative images of four independent experiments are shown. E, Western blot analysis of total protein extracts of LLC-AQP2 and mCCDcl1 cells (top) and streptavidin-agarose-precipitated biotinylated AQP2 expressed at the apical surface of LLC-AQP2 cells (bottom). Although 30 min of hypertonic challenge increased AQP2 expression at the apical surface of LLC-AQP2 cells, it did not affect whole-cell AQP2 abundance. Apical AQP2 was not detected in cells that were not labeled with biotin (No biotin). Whole-cell AQP2 abundance in mCCDcl1 cells was not altered by 30 min of hypertonic challenge but increased 12-fold after 24 h of hypertonic stimulation, similar to the effect previously observed in mpkCCDcl4 cells (15). Actin was used as a loading control for whole-cell lysates. Representative images of three independent experiments are shown.
FIGURE 3.
FIGURE 3.
Increased cell surface expression of AQP2 by hypertonicity is not a general phenomenon affecting all plasma membrane-bound proteins. The effects of hypertonicity on cell surface expression of Glut1 (A) and V2R(B) was compared with that of AQP2. A, LLC-AQP2 cells were challenged or not (Ctl) with NaCl-enriched hypertonic (500 mosmol/kg) medium for 30 min prior to fixation and staining with anti-c-myc and anti-Glut1 antibodies for detection of AQP2 (red; 1 and 2) and Glut1 (green; 3 and 4), respectively. Although AQP2 accumulated at both the cell surface and in a perinuclear region following hypertonic challenge (2), Glut1 only redistributed to a perinuclear region (4). B, LLC-V2R-GFP cells were challenged or not (Ctl) with hypertonic medium for 10 min and then for an additional 20 min with or without vasopressin prior to fixation and staining with an anti-c-myc antibody for detection of AQP2 (red; 1–4). V2R expression was detected as a green (GFP) signal (5–8). In the presence of VP, although hypertonic challenge led to an increase of AQP2 at the cell surface (4), V2R was predominantly expressed in a perinuclear region (8). Bar, 15 μm. Representative images of three independent experiments are shown. V2R cell surface expression was determined as described under “Experimental Procedures.” Results are mean ± S.E. (n = 3). *, p < 0.05.
FIGURE 4.
FIGURE 4.
AQP2 accumulates in the trans-Golgi region in response to acute hypertonicity. A, LLC-AQP2 cells were challenged with NaCl-enriched hypertonic (500 mosmol/kg) medium prior to fixation and staining with anti-c-myc (for detection of AQP2; red) and with either anti-golgin-97 (green; right) or anti-clathrin (green; left) antibodies and confocal microscopy imaging. Three focal planes are shown. B, LLC-AQP2 cells were pretreated for 30 min with cycloheximide (CHX; 1 and 2) or brefeldin A (BrefA; 3 and 4) and then challenged with isotonic (300 mosmol/kg; 300) or NaCl-enriched hypertonic (500 mosmol/kg; 500) medium for an additional 30 min prior to fixation, staining with an anti-c-myc antibody, and epifluorescence microscopy analysis. For experiments performed with bafilomycin (Bafilo; 5 and 6), LLC-AQP2 cells were simultaneously challenged with bafilomycin and either isotonic (300) or hypertonic (500) medium for 30 min prior to fixation, staining with an anti-c-myc antibody, and epifluorescence microscopy analysis. Bar, 10 μm. Images representative of three independent experiments are shown.
FIGURE 5.
FIGURE 5.
Acute hypertonicity induces segregation of Ser256 phosphorylated and nonphosphorylated AQP2 into separate compartments. LLC-AQP2 (S256D) (A–C), LLC-AQP2 (S256A) (D–F), or LLC-AQP2 cells (quantified in G) were challenged or not (Ctl) for 30 min with either NaCl-enriched hypertonic (500 mosmol/kg) medium or VP prior to fixation and staining with an anti-c-myc antibody. Bar, 10 μm. G, AQP2 cell surface expression was determined as described under “Experimental Procedures.” Results are mean ± S.E. (n = 5). *, p < 0.05. NS, not significant.
FIGURE 6.
FIGURE 6.
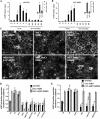
AQP2 accumulation at the cell surface following acute hypertonicity occurs independently of a rise of cAMP concentration. MCCDcl1 cells (A) and LLC-AQP2 cells (B) were preincubated or not for 30 min with IBMX and challenged or not (Ctl) for 30 min with either NaCl-enriched hypertonic (350–600 mosmol/kg) medium or various concentrations of VP prior to cell lysis and determination of cAMP concentration. The ratio of cAMP concentration measured for each experimental condition and that measured in nonstimulated (Ctl) cells, in the absence and presence (inset) of IBMX, is shown. Results are mean ± S.E.(n=4). *, p<0.05. C–E, mCCDcl1, LLC-AQP2, LLC-AQP2 (S256D), and LLC-AQP2 (S256A) cells were preincubated or not for 5 min with calmodulin inhibitors MDC or W-7 and then challenged or not (Ctl) for 30 min with either NaCl-enriched hypertonic (500 mosmol/kg) medium or VP prior to fixation and staining with anti-c-myc (for LLC-PK1 cells) or anti-AQP2 (for mCCDcl1 cells) antibodies. C, representative immunofluorescent images of LLC-AQP2 (1 and 4), LLC-AQP2 (S256A) (2 and 5), and LLC-AQP2 (S256D) cells (3 and 6) depicting the effects of MDC on AQP2 trafficking under hypertonic conditions. Bar, 10 μm. D and E, AQP2 cell surface expression was determined as described under “Experimental Procedures.” Results are mean ± S.E. (n = 4). ND, not determined. *, p < 0.05; **, p < 0.01.
FIGURE 7.
FIGURE 7.
Effect of MAPK pharmacological inhibitors on hypertonicity-induced MAPK activity. mCCDcl1 and LLC-AQP2 cells were preincubated or not 30 min with p38 MAPK inhibitors SB 202190 (SB202) or SB 203580 (SB203) (A), with MEK-1 and -2 inhibitors PD 98059 or U0126 (B), or with the JNK inhibitor SP600125 (SP600) (C) and then challenged or not (Ctl) for 30 min with either NaCl- or mannitol-hypertonic (500 mosmol/kg) medium, with urea-hyperosmotic (500 mosmol/kg) medium or with VP. Cells were lysed, and total protein extracts were separated by SDS-PAGE, and phospho-p38 MAPK, phospho-ERK1/2 MAPK, and phospho-JNK MAPK as well as their nonphosphorylated forms were detected by Western blot using polyclonal antibodies. Representative immunoblots are shown. Densitometric quantification of phosphorylated MAPKs expressed as the ratio of optical density values measured for each experimental condition versus nonstimulated (Ctl, lane 1) cells is shown. Results are mean ± S.E. (n = 3).
FIGURE 8.
FIGURE 8.
AQP2 accumulation at the cell surface, but not the trans-Golgi region, following acute hypertonicity depends on p38 MAPK activity. mCCDcl1, LLC-AQP2, LLC-AQP2 (S256D), and LLC-AQP2 (S256A) cells were preincubated or not for 30 min with p38 MAPK inhibitors SB 202190 (SB202) or SB 203580 (SB203) and then challenged or not (Ctl) for 30 min with either NaCl-enriched hypertonic (500 mosmol/kg) medium or VP. Cells were fixed and stained with anti-c-myc (for LLC-PK1 cells) or anti-AQP2 (for mCCDcl1 cells) antibodies for analysis of AQP2 expression at the cell surface and trans-Golgi region. Representative immunofluorescent images of mCCDcl1 (A), LLC-AQP2 (S256A) (B; 1 and 3) and LLC-AQP2 (S256D) cells (B; 2 and 4) depicting the effects of SB 203580 on AQP2 trafficking under hypertonic conditions are shown. Bar, 7 μm (A) and 10 μm (B). C, AQP2 cell surface expression was determined as described under “Experimental Procedures.” Results are mean ± S.E. (n = 4). *, p < 0.05; **, p < 0.01.
FIGURE 9.
FIGURE 9.
AQP2 accumulation at the cell surface, but not the trans-Golgi region, following acute hypertonicity depends on ERK1/2 MAPK activity. mCCDcl1, LLC-AQP2, LLC-AQP2 (S256D), and LLC-AQP2 (S256A) cells were preincubated or not for 30 min with MEK-1 and -2 inhibitors PD 98059 or U0126 and then challenged or not (Ctl) for 30 min with either NaCl-enriched hypertonic (500 mosmol/kg) medium or VP. Cells were fixed and stained with anti-c-myc (for LLC-PK1 cells) or anti-AQP2 (for mCCDcl1 cells) for analysis of AQP2 expression at the cell surface and trans-Golgi region. Representative immunofluorescent images of mCCDcl1 (A), LLC-AQP2 (S256A) (B; 1 and 3), and LLC-AQP2 (S256D) cells (B; 2 and 4) depicting the effects of U0126 on AQP2 trafficking under hypertonic conditions are shown. Bar, 7 μm (A) and 10 μm (B). C, AQP2 cell surface expression was determined as described under “Experimental Procedures.” Results are mean ± S.E. (n = 4). *, p < 0.05; **, p < 0.01.
FIGURE 10.
FIGURE 10.
AQP2 accumulation at the cell surface, but not the trans-Golgi region, following acute hypertonicity depends on JNK MAPK activity. mCCDcl1, LLC-AQP2, LLC-AQP2 (S256D), and LLC-AQP2 (S256A) cells were preincubated or not for 30 min with the JNK inhibitor SP600125 (SP600) and then challenged or not (Ctl) for 30 min with either NaCl-enriched hypertonic (500 mosmol/kg) medium or VP. Cells were fixed and stained with anti-c-myc (for LLC-PK1 cells) or anti-AQP2 (for mCCDcl1 cells) for analysis of AQP2 expression at the cell surface and trans-Golgi region. Representative immunofluorescent images of mCCDcl1 (A), LLC-AQP2 (S256A) (B; 1 and 3), and LLC-AQP2 (S256D) cells (B; 2 and 4) depicting the effects of SP600125 on AQP2 trafficking under hypertonic conditions are shown. Bar, 7 μm (A) and 10 μm (B). C, AQP2 cell surface expression was determined as described under “Experimental Procedures.” Results are mean ± S.E. (n = 4). **, p < 0.01.
FIGURE 11.
FIGURE 11.
Acute hypertonicity decreases both AQP2 endocytosis and exocytosis. A, mCCDcl1 and LLC-AQP2 cells were challenged with isotonic (300 mosmol/kg) or hypertonic (500 mosmol/kg) medium in the presence of FITC-dextran for various periods of time (3–30 min) and were then rinsed and fixed. Representative immunofluorescent images of internalized FITC-dextran in LLC-AQP2 cells are shown after 20 min of exposure to either medium. Bar, 10 μm. FITC-dextran internalization was quantified as described under “Experimental Procedures” and expressed as the ratio of pixel intensity measured for each experimental condition and that measured in cells subjected to isotonic medium for 20 min (for mCCDcl1 cells) or 3 min (for LLC-AQP2 cells). Results are mean ± S.E. (n = 4). *, p < 0.05. B, LLC-AQP2 (S256D) (1 and 2), LLC-AQP2 (S256A) (3 and 4) and LLC-AQP2 cells (quantified as graphically depicted on the right) were maintained in isotonic medium and then exposed or not (control) to mβCD for 30 min prior to fixation and staining with an anti-c-myc antibody. Bar, 10 μm. AQP2 cell surface expression was determined as described under “Experimental Procedures.” Results are mean ± S.E. (n = 3). *, p < 0.05. NS, not significant. C, LLC-ssYFP cells that express AQP2 and soluble secreted YFP were incubated in Hanks' buffer for 1 h and then stimulated or not (300) for 0–60 min with either NaCl-enriched hypertonic (500 mosmol/kg) medium or VP prior to collection of extracellular medium and analysis of YFP fluorescence. The ratio of YFP secretion, reflecting AQP2 exocytosis, is shown between each experimental condition, and cells were subjected to isotonic solution for 30 min in the absence of VP. Results are mean ± S.E. (n = 5). *, p < 0.05.
FIGURE 12.
FIGURE 12.
Effects of acute hypertonicity on AQP2 trafficking. Although AQP2 constitutively recycles between the cell surface and the TGN under hypertonic conditions, AQP2 accumulates at both of these regions at the onset of hypertonic challenge. Hypertonicity reduces both endocytotic and exocytotic activity in epithelial renal cells. Although AQP2 accumulation at the plasma membrane (PM) depends on both PKA activity and Ser256 phosphorylation, it occurs independently of a rise of intracellular cAMP. AQP2 accumulation at the plasma membrane, but not at the TGN, depends on an increase of hypertonicity-induced p38, ERK1/2, and JNK1/2 MAPK activity. Events that are induced by hypertonicity are depicted as a plus sign, and those that are repressed by hypertonicity are depicted as a minus sign.

Similar articles

Cited by

References

    1. Van Hoek, A., Huang, Y., and Fang, P. (2001) in Protein Adaptations and Signal Transduction, pp. 73-85, Elsevier Science B.V., Amsterdam
    1. Di Ciano-Oliveira, C., Thirone, A. C., Szaszi, K., and Kapus, A. (2006) Acta Physiol. (Oxford) 187 257-272 - PubMed
    1. Nasuhoglu, C., Feng, S., Mao, Y., Shammat, I., Yamamato, M., Earnest, S., Lemmon, M., and Hilgemann, D. W. (2002) Am. J. Physiol. 283 C223-C234 - PubMed
    1. Rehn, M., Weber, W. M., and Clauss, W. (1998) Pflugers Arch. 436 270-279 - PubMed
    1. Sheikh-Hamad, D., and Gustin, M. C. (2004) Am. J. Physiol. 287 F1102-F1110 - PubMed

Publication types

MeSH terms

LinkOut - more resources