. 2008 Dec;10(6):981-94.
doi: 10.1215/15228517-2008-048. Epub 2008 Jul 29.

Global analysis of the medulloblastoma epigenome identifies disease-subgroup-specific inactivation of COL1A2

Affiliations

Global analysis of the medulloblastoma epigenome identifies disease-subgroup-specific inactivation of COL1A2

Jennifer A Anderton et al. Neuro Oncol. 2008 Dec.

Abstract

Candidate gene investigations have indicated a significant role for epigenetic events in the pathogenesis of medulloblastoma, the most common malignant brain tumor of childhood. To assess the medulloblastoma epigenome more comprehensively, we undertook a genomewide investigation to identify genes that display evidence of methylation-dependent regulation. Expression microarray analysis of medulloblastoma cell lines following treatment with a DNA methyltransferase inhibitor revealed deregulation of multiple transcripts (3%-6% of probes per cell line). Eighteen independent genes demonstrated >3-fold reactivation in all cell lines tested. Bisulfite sequence analysis revealed dense CpG island methylation associated with transcriptional silencing for 12 of these genes. Extension of this analysis to primary tumors and the normal cerebellum revealed three major classes of epigenetically regulated genes: (1) normally methylated genes (DAZL, ZNF157, ASN) whose methylation reflects somatic patterns observed in the cerebellum, (2) X-linked genes (MSN, POU3F4, HTR2C) that show disruption of their sex-specific methylation patterns in tumors, and (3) tumor-specific methylated genes (COL1A2, S100A10, S100A6, HTATIP2, CDH1, LXN) that display enhanced methylation levels in tumors compared with the cerebellum. Detailed analysis of COL1A2 supports a key role in medulloblastoma tumorigenesis; dense biallelic methylation associated with transcriptional silencing was observed in 46 of 60 cases (77%). Moreover, COL1A2 status distinguished infant medulloblastomas of the desmoplastic histopathological subtype, indicating that distinct molecular pathogenesis may underlie these tumors and their more favorable prognosis. These data reveal a more diverse and expansive medulloblastoma epi genome than previously understood and provide strong evidence that the methylation status of specific genes may contribute to the biological subclassification of medulloblastoma.


Figures
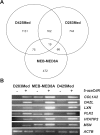
Fig. 1.
Fig. 1.
Probes upregulated >3-fold following treatment by the DNA methyltransferase inhibitor 5′-aza-2′-deoxycytidine (5-azaCdR) in three medulloblastoma cell lines. (A) Venn diagram showing the total number of probes upregulated in each cell line and those common to multiple cell lines. (B) Independent confirmation of microarray expression changes by reverse transcription (RT)-PCR analysis. RT-PCR analysis is shown for six selected genes (COL1A2, DAZL, LXN, PLK2, HTATIP2, and MSN) that showed upregulation by microarray analysis in all three cell lines following 5-azaCdR treatment, and ACTB, an unmethylated control housekeeping gene.
Fig. 2.
Fig. 2.
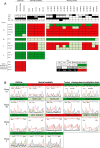
Identification of methylated genes in medulloblastoma cell lines, primary tumors, and the normal cerebellum. (A) CpG island methylation status of 16 genes determined by bisulfite sequencing and estimation of relative peak heights. Dark green boxes, fully methylated (Meth (full); ≥75% methylation observed at ≥75% assessed sites); light green boxes, partially methylated (Meth (part); ≥25% methylation observed at ≥25% of assessed sites); red boxes, unmethylated (Unmeth; <25% methylation observed at >75% assessed sites). n/a, data not available; Mstage, metastatic stage; ND, desmoplastic/nodular; LCA, large cell/anaplastic. (B) Representative bisulfite sequence analyses of selected genes showing methylation patterns observed in cell lines, normal cerebella, and primary tumors. CpG sites are underlined. Boxes are coded in dark green, light green, and red as in A to reflect the methylation status of the whole CpG island.
Fig. 3.
Fig. 3.
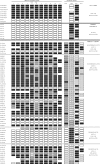
Detailed analysis of the methylation status of COL1A2 in medulloblastoma cell lines, primary tumors, and the normal cerebellum: analysis of methylation levels by bisulfite sequencing and estimation of relative peak heights at 11 CpG residues within the promoter-associated CpG island of COL1A2 (spanning from the CpG site at −172 bp relative to the translational start site of Ensembl transcript ENST00000297268 [no. 1] to the CpG site at −34 bp [no. 11]; see Supplementary Data Table [online only, with this article at neuro-oncology.dukejournals.org] for further details). Black boxes, >75% methylation; gray boxes, 25%–75% methylation; white boxes <25% methylation; no box, data not available. Clinicopathological information for tumors is color coded as shown in the key to Fig. 2. Individual ages for patients are given in years. #Tumors for which expression array analysis was available (see Fig. 4). *Cerebella for which real-time PCR analysis of COL1A2 expression was performed.
Fig. 4.
Fig. 4.
Methylation-dependent epigenetic silencing of COL1A2 expression in medulloblastoma cell lines and primary tumors. (A) Real-time reverse transcription PCR analysis of COL1A2 mRNA expression in medulloblastoma cell lines before (−) and after (+) 5′-aza-2′-deoxycytidine (5-azaCdR) treatment and in the normal cerebellum. Results show the average COL1A2 expression (+SEM) based on three independent replicates calculated relative to the control gene TBP. (B) Western blot analysis of collagen type 1 protein and α-tubulin (control) expression in methylated (M) and unmethylated (U) medulloblastoma cell lines. (C) COL1A2 expression in methylated and unmethylated primary tumors. Data points represent signal intensities for individual tumors; lines denote mean expression for each group. Signal intensities generated on the Affymetrix U133Av2 array were calculated by MAS5 software and were taken from a publicly available data set (www.stjuderesearch.org/data/medulloblastoma/).
Fig. 5.
Fig. 5.
COL1A2 mRNA expression is elevated in infant desmoplastic/nodular tumors compared with other medulloblastomas. Data points represent signal intensities for individual tumors; lines denote mean expression for each group. Signal intensities generated on the Affymetrix U133Av2 array were calculated by MAS5 software and are taken from a publicly available data set.

References

    1. Ellison DW, Clifford SC, Gajjar A, Gilbertson RJ. What’s new in neuro-oncology? Recent advances in medulloblastoma. Eur J Paediatr Neurol. 2003;7:53–66. - PubMed
    1. Ellison DW, Clifford SC, Giangaspero F. Medulloblastoma. In: McLendon RE, Rosenblum MK, Bigner DD, editors. Russell and Rubenstein’s Pathology of Tumours of the Nervous System. 7th ed. London: Hodder Arnold; 2006. pp. 247–264.
    1. Ellison DW, Onilude OE, Lindsey JC, et al. beta-Catenin status predicts a favorable outcome in childhood medulloblastoma: the United Kingdom Children’s Cancer Study Group Brain Tumour Committee. J Clin Oncol. 2005;23:7951–7957. - PubMed
    1. Thompson MC, Fuller C, Hogg TL, et al. Genomics identifies medulloblastoma subgroups that are enriched for specific genetic alterations. J Clin Oncol. 2006;24:1924–1931. - PubMed
    1. McManamy CS, Lamont JM, Taylor RE, et al. Morphophenotypic variation predicts clinical behavior in childhood non-desmoplastic medulloblastomas. J Neuropathol Exp Neurol. 2003;62:627–632. - PubMed

Publication types

MeSH terms