. 2009 Feb;457(4):757-69.
doi: 10.1007/s00424-008-0550-1. Epub 2008 Jul 30.

Complex functions of phosphatidylinositol 4,5-bisphosphate in regulation of TRPC5 cation channels

Affiliations

Complex functions of phosphatidylinositol 4,5-bisphosphate in regulation of TRPC5 cation channels

Mohamed Trebak et al. Pflugers Arch. 2009 Feb.

Abstract

The canonical transient receptor potential (TRPC) proteins have been recognized as key players in calcium entry pathways activated through phospholipase-C-coupled receptors. While it is clearly demonstrated that members of the TRPC3/6/7 subfamily are activated by diacylglycerol, the mechanism by which phospholipase C activates members of the TRPC1/4/5 subfamily remains a mystery. In this paper, we provide evidence for both negative and positive modulatory roles for membrane polyphosphoinositides in the regulation of TRPC5 channels. Depletion of polyphosphatidylinositol 4-phosphate and phosphatidylinositol 4,5-bisphosphate (PIP2) through inhibition of phosphatidylinositol 4-kinase activates calcium entry and membrane currents in TRPC5-expressing but not in TRPC3- or TRPC7-expressing cells. Inclusion of polyphosphatidylinositol 4-phosphate or PIP2, but not phosphatidylinositol 3,4,5-trisphosphate, in the patch pipette inhibited TRPC5 currents. Paradoxically, depletion of PIP2 with a directed 5-phosphatase strategy inhibited TRPC5. Furthermore, when the activity of single TRPC5 channels was examined in excised patches, the channels were robustly activated by PIP2. These findings indicate complex functions for regulation of TRPC5 by PIP2, and we propose that membrane polyphosphoinositides may have at least two distinct functions in regulating TRPC5 channel activity.


Figures

Figure 1
Figure 1. Modes of activation of TRPC5
A. HEK293 cells stably expressing TRPC5 channels exhibit a receptor-induced Ca2+ entry that is insensitive to low concentrations of Gd3+ (5 μM Gd3+) that block the endogenous capacitative calcium entry (solid trace). Agonist-induced Ca2+ entry in wild type HEK293 (HEK-Wt) cells is completely abolished by 5 μM Gd3+ (dotted trace). B. TRPC5 channels can be activated by high concentrations of Gd3+ (50 μM). 50 μM Gd3+ induces a calcium entry in TRPC5-expressing HEK293 cells (solid trace) but not in wild type cells (dotted trace). C. Unlike TRPC3 channels that can be activated by diacylglycerol analogs (OAG, solid trace), TRPC5-expressing HEK293 cells show no calcium entry after addition of 100 μM OAG (dotted trace). OAG failed to activate TRPC5 even in the presence of protein kinase C inhibitors (data not shown). In A and C, experiments were initiated in the absence of Ca2+, and Ca2+ restored as indicated, while in B, Ca2+ was present throughout. Shown are average traces from 23–58 cells, representative of a total of at least 4 independent experiments.
Figure 2
Figure 2. Phosphatidylinositol 4-kinase (PI-4K) inhibitors activate TRPC5 but not TRPC3
A. Wortmannin (20 μM) induces Ca2+ entry in TRPC5-expressing HEK293 cells (solid trace) but has no effect on wild type cells (dotted trace, WT). Gray trace: DMSO control for TRPC5 cells. B. Similar results are obtained for another PI-4K inhibitor, LY294002 (100 μM). C. LY294002 (100 μM) activated a robust Ca2+ entry in TRPC5-expressing HEK293 cells (solid trace) while it had no effect on TRPC3-expressing cells (dotted trace). Gray trace, DMSO control for TRPC5 cells. D. LY294002 (100 μM) inhibited TRPC3-mediated Ca2+ entry in response to agonist stimulation (methacholine, MeCh 300 μM). Black trace, absence of LY294002; gray trace, presence of LY294002; Iono., 10 μM ionomycin. Shown are average traces from at least 50 cells, representative of a total of 3–8 independent experiments.
Figure 3
Figure 3. The muscarinic agonist carbachol (200 μM), and the PI4-K inhibitors, LY294002 (100 μM) and Wortmannin (20 μM) activate inward and outward currents measured by the perforated patch technique in TRPC5-expressing HEK293 cells
The upper panels show representative time courses of current development (at −100 and +100 mV) using the Nystatin-perforated patch mode before and after stimulation with CCh (200 μM; A), LY294002 (100 μM, B) and Wortmannin (20 μM, C). Lower panels show the corresponding current/voltage (I/V) relationship for CCh (D), LY294002 (E) and Wortmannin (F). Sweeps were taken before (a) and after (b) addition of stimuli at the times indicated in the corresponding time course traces (upper panels). In these experiments, series resistance was in the range of 33 – 50 MΩ.
Figure 4
Figure 4. The muscarinic agonist methacholine (300 μM) and Wortmannin (20 μM) activate an inward and outward current measured by the whole-cell patch-clamp technique in TRPC5-expressing HEK293 cells
A. Whole cell current densities in a TRPC5-expressing cell sampled at +100 mV and −100 mV. B. Current Voltage (I/V) relationship in a TRPC5-expressing cell subjected to 250 ms voltage ramps between −100 and +100 mV, before (black trace) and after (gray trace) addition of methacholine. Representative of 6 independent experiments. C. Wortmannin (20 μM) induces an increase in both inward and outward whole cell currents in TRPC5-expressing cells, with no effect on HEK-Wt or TRPC3-expressing HEK293 cells (not shown). The data are averages of the maximum inward and outward currents before and after wortmannin addition from 17 (control) and 15 (wortmannin) experiments. D. The IV curve obtained after addition of wortmannin (20 μM) to TRPC5-expressing cells is similar to that obtained after stimulation of these cells with methacholine (see B). Representative data from a single experiment from the experiments summarized in C.
Figure 5
Figure 5. PIP2 and PIP, but not PIP3 inhibit wortmannin-activated TRPC5 currents
A. TRPC5-expressing HEK293 cells were treated with wortmannin (20 μM) for 30 minutes. Whole cell measurements were made in the absence (open circles, n=6) or presence (filled circles) of 20 μM PIP2 (n=6, panel A), 20 μM PIP (n=5, panel B), or 20 μM PIP3 (n=6, panel C) in the patch pipette. After break-in, there was a brief period of current run-up (~10 pA/pF). Following stabilization of the current, (~50 sec), data (outward at +100 mV, inward at −100 mV) were collected and normalized by ratio to the initial current density (I0). The differences (control vs. lipid-treated) in inward and outward currents at the end of data collection were analyzed by t-tests; the levels of significance were: PIP2, inward, P = 0.059 (NS), outward, P = 0.004; PIP, inward, P = 0.049, outward, P = 0.012; PIP3, inward, P = 0.445 (NS), outward, P = 0.519 (NS).
Figure 6
Figure 6. PIP2 directly activates TRPC5 channels in the inside-out configuration
A: Representative traces showing TRPC5 activity at +60 mV immediately after excising a membrane patch from a cell exposed to wortmannin (top trace), and after a subsequent application of 10 μM PIP2 (bottom trace). B: Corresponding NPo versus time plots for the same cell. Arrows indicate solution exchanges.
Figure 7
Figure 7. TRPC5 is specifically activated by PIP2 at the single channel level
A: Histograms summarizing changes observed in NPo at +60 mV during inside-out experiments where patches were exposed to a regular external solution (cont.), and then to the same solution supplemented with 20 μM wortmannin alone (WT) or in the presence of 10 μM PIP2; representative of 4 patches obtained in 4 independent cells. B: Same as in A, but patches were exposed to 5 mM ATP alone (ATP) or in the presence of 10 μM PIP2 (ATP+PIP2); representative of 4 patches obtained in 4 independent cells. C: Same as A and B, but patches were sequentially exposed to the regular external solution (Cont.), 10 μM GPIP2, 0.5 μg/ml poly-L-Lysine (PL) and 10 μM PIP2; representative of 6 patches obtained in 6 independent cells.
Figure 8
Figure 8. PIP2 depletion using plasma membrane targeted- PI5-phosphatase inhibits TRPC5
Time course of average fluorescence ratio in TRPC5-expressing HEK293 cells loaded with Fura-2. Cells were exposed to a maximal dose of Carbachol (CCh: 100 μM) in the presence of 2 mM external Ca2+ solution and a low dose of Gd3+ (5 μM) to block the endogenous store-operated Ca2+ entry pathway, as indicated by the horizontal arrow bars. Once the TRPC5-mediated Ca2+ entry fully developed, rapamycin (100 nM) was added where indicated. The trace shown represents average data of 21 cells from a recording representative of at least four separate experiments.
Figure 9
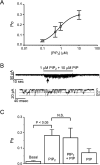
Figure 9. PIP weakly activates TRPC5 channels, but does not interfere with the ability of PIP2 to activate the channels
A: Concentration-response curve showing the concentration-dependent effects of bath applied PIP2 on TRPC5 channels. Single channel events were recorded at 80 mV (10 μM: n=4; 1 μM: n=10; 500 nM: n=4; 100 nM: n=4). B: Representative traces showing TRPC5 activity before, during and after the simultaneous addition of 1 μM PIP2 and 10 μM PIP to the cytosolic side of the membrane patch through the bathing solution. Arrow on top trace indicates where the 300 msec bottom trace was taken, showing TRPC5 activity under the presence of both PIP and PIP2. C: Bar graph indicating the effects of 1μM PIP2 alone (n=10), 10 μM PIP alone (n=3), or PIP2 plus PIP (n=7) (added simultaneously as seen in panel B), as well as TRPC5 basal activity recorded before the addition of PIP or PIP2 (n=8). Error bars indicate means ± SEM.
Figure 10
Figure 10. Model for PIP2 regulation of TRPC5 channels
In intact cells, agonist (Ag) activation of PLC, or inhibition of PI4-K by wortmannin, leads to reduction of PIP or PIP2, and dissociation of a polyphosphoinositide-dependent inhibitor of TRPC5. PIP2 associated with the channel is required for activity; thus, removal of the PIP2-dependent inhibitor leads to channel activation. In excised patches, both the PIP2 required for channel activity, as well as the inhibitor are lost; thus addition of PIP2 leads to robust channel activation.

References

    1. Berridge MJ. Inositol trisphosphate and calcium signalling. Nature. 1993;361:315–325. - PubMed
    1. Putney JW. A model for receptor-regulated calcium entry. Cell Calcium. 1986;7:1–12. - PubMed
    1. Berridge MJ. Capacitative calcium entry. Biochem J. 1995;312:1–11. - PMC - PubMed
    1. Parekh AB, Putney JW. Store-operated calcium channels. Physiol Rev. 2005;85:757–810. - PubMed
    1. Barritt GJ. Receptor-activated Ca2+ inflow in animal cells: a variety of pathways tailored to meet different intracellular Ca2+ signalling requirements. Biochem J. 1999;337:153–169. - PMC - PubMed

Publication types

MeSH terms

LinkOut - more resources