

Guiding protein aggregation with macromolecular crowding
- PMID: 18665616
- PMCID: PMC2676887
- DOI: 10.1021/bi8008399
Guiding protein aggregation with macromolecular crowding
Abstract
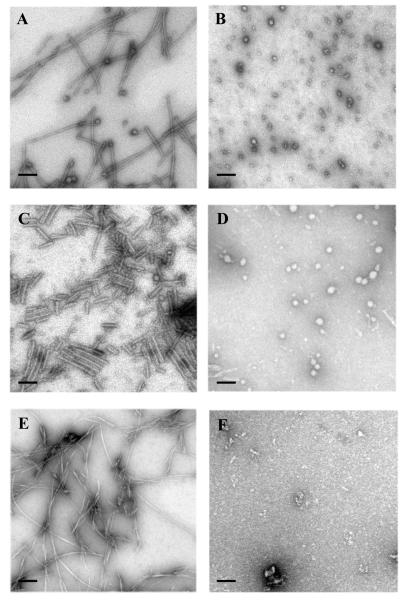
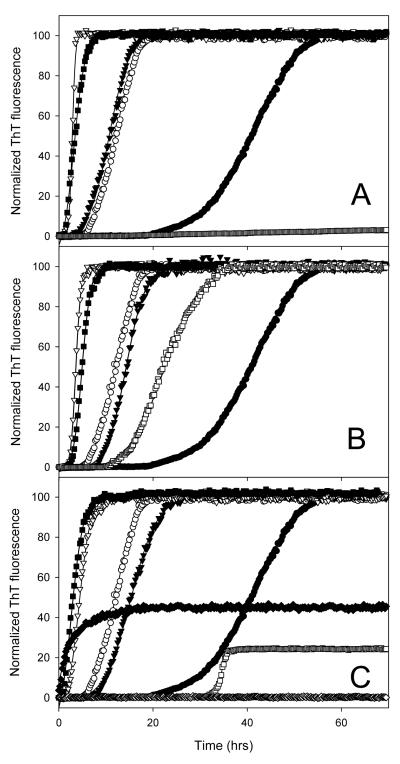
Macromolecular crowding is expected to have a significant effect on protein aggregation. In the present study we analyzed the effect of macromolecular crowding on fibrillation of four proteins, bovine S-carboxymethyl-alpha-lactalbumin (a disordered form of the protein with reduced three out of four disulfide bridges), human insulin, bovine core histones, and human alpha-synuclein. These proteins are structurally different, varying from natively unfolded (alpha-synuclein and core histones) to folded proteins with rigid tertiary and quaternary structures (monomeric and hexameric forms of insulin). All these proteins are known to fibrillate in diluted solutions, however their aggregation mechanisms are very divers and some of them are able to form different aggregates in addition to fibrils. We studied how macromolecular crowding guides protein between different aggregation pathways by analyzing the effect of crowding agents on the aggregation patterns under the variety of conditions favoring different aggregated end products in diluted solutions.
Figures


Similar articles
-
Conformational prerequisites for alpha-lactalbumin fibrillation.Biochemistry. 2002 Oct 15;41(41):12546-51. doi: 10.1021/bi0262698. Biochemistry. 2002. PMID: 12369846
-
Impact of Tyr to Ala mutations on alpha-synuclein fibrillation and structural properties.Biochim Biophys Acta. 2008 Oct;1782(10):581-5. doi: 10.1016/j.bbadis.2008.07.004. Epub 2008 Jul 22. Biochim Biophys Acta. 2008. PMID: 18692132
-
Forcing nonamyloidogenic beta-synuclein to fibrillate.Biochemistry. 2005 Jun 28;44(25):9096-107. doi: 10.1021/bi048778a. Biochemistry. 2005. PMID: 15966733
-
The role of crowded physiological environments in prion and prion-like protein aggregation.Int J Mol Sci. 2013 Oct 25;14(11):21339-52. doi: 10.3390/ijms141121339. Int J Mol Sci. 2013. PMID: 24284393 Free PMC article. Review.
-
Neuropathology, biochemistry, and biophysics of alpha-synuclein aggregation.J Neurochem. 2007 Oct;103(1):17-37. doi: 10.1111/j.1471-4159.2007.04764.x. Epub 2007 Jul 10. J Neurochem. 2007. PMID: 17623039 Review.
Cited by
-
Osmotic stress changes the expression and subcellular localization of the Batten disease protein CLN3.PLoS One. 2013 Jun 20;8(6):e66203. doi: 10.1371/journal.pone.0066203. Print 2013. PLoS One. 2013. PMID: 23840424 Free PMC article.
-
Ionic imbalance, in addition to molecular crowding, abates cytoskeletal dynamics and vesicle motility during hypertonic stress.Proc Natl Acad Sci U S A. 2015 Jun 16;112(24):E3104-13. doi: 10.1073/pnas.1421290112. Epub 2015 Jun 4. Proc Natl Acad Sci U S A. 2015. PMID: 26045497 Free PMC article.
-
Modulation of α-synuclein aggregation amid diverse environmental perturbation.Elife. 2024 Aug 1;13:RP95180. doi: 10.7554/eLife.95180. Elife. 2024. PMID: 39087984 Free PMC article.
-
Effect of an Intrinsically Disordered Plant Stress Protein on the Properties of Water.Biophys J. 2018 Nov 6;115(9):1696-1706. doi: 10.1016/j.bpj.2018.09.014. Epub 2018 Sep 22. Biophys J. 2018. PMID: 30297135 Free PMC article.
-
Structure-Activity Relationship of the Dimeric and Oligomeric Forms of a Cytotoxic Biotherapeutic Based on Diphtheria Toxin.Biomolecules. 2022 Aug 12;12(8):1111. doi: 10.3390/biom12081111. Biomolecules. 2022. PMID: 36009005 Free PMC article.
References
-
- Zimmerman SB, Trach SO. Estimation of macromolecule concentrations and excluded volume effects for the cytoplasm of Escherichia coli. J Mol Biol. 1991;222:599–620. - PubMed
-
- Fulton AB. How crowded is the cytoplasm? Cell. 1982;30:345–347. - PubMed
-
- Zimmerman SB, Minton AP. Macromolecular crowding: biochemical, biophysical, and physiological consequences. Annu Rev Biophys Biomol Struct. 1993;22:27–65. - PubMed
-
- Minton AP. Influence of excluded volume upon macromolecular structure and associations in ‘crowded’ media. Curr Opin Biotechnol. 1997;8:65–69. - PubMed
-
- Minton AP. Implications of macromolecular crowding for protein assembly. Curr Opin Struct Biol. 2000;10:34–39. - PubMed
Publication types
MeSH terms
Substances
Grants and funding
LinkOut - more resources
Full Text Sources
Other Literature Sources
