. 2008 Aug;60(2):357-63.
doi: 10.1002/mrm.21627.

Quantitative evaluation of oxygenation in venous vessels using T2-Relaxation-Under-Spin-Tagging MRI

Affiliations

Quantitative evaluation of oxygenation in venous vessels using T2-Relaxation-Under-Spin-Tagging MRI

Hanzhang Lu et al. Magn Reson Med. 2008 Aug.

Abstract

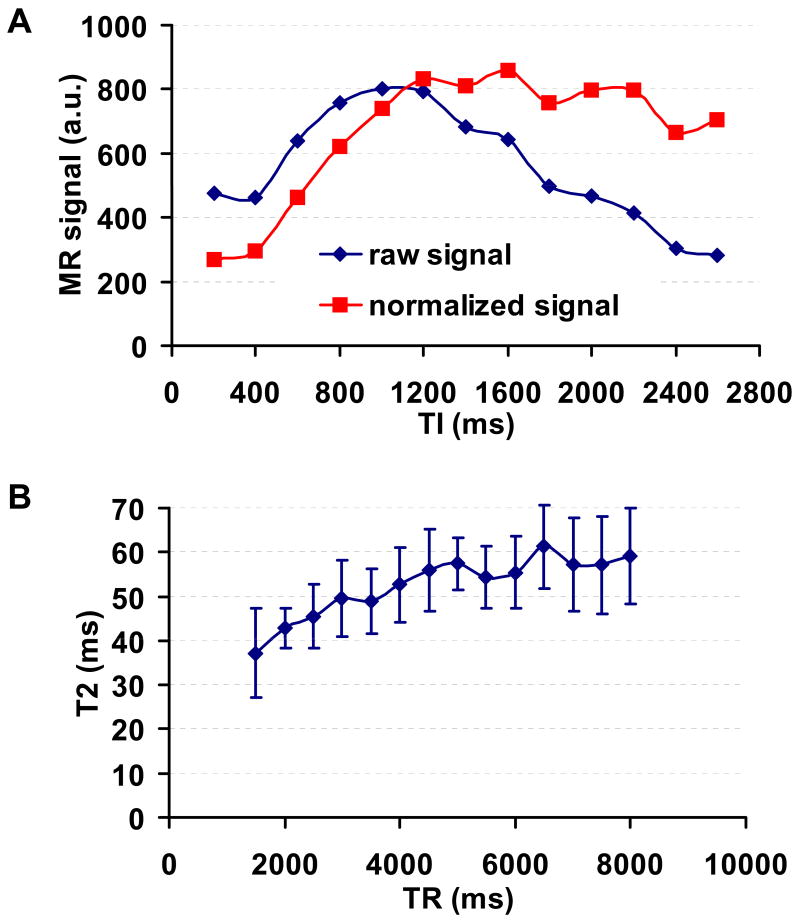
Noninvasive measurement of cerebral venous oxygenation can serve as a tool for better understanding fMRI signals and for clinical evaluation of brain oxygen homeostasis. In this study a novel technique, T2-Relaxation-Under-Spin-Tagging (TRUST) MRI, is developed to estimate oxygenation in venous vessels. This method uses the spin labeling principle to automatically isolate pure blood signals from which T2 relaxation times are determined using flow-insensitive T2-preparation pulses. The blood T2 is then converted to blood oxygenation using a calibration plot. In vivo experiments gave a baseline venous oxygenation of 64.8 +/- 6.3% in sagittal sinus in healthy volunteers (n = 24). Reproducibility studies demonstrated that the standard deviation across trials was 2.0 +/- 1.1%. The effects of repetition time and inversion time selections were investigated. The TRUST technique was further tested using various physiologic challenges. Hypercapnia induced an increase in venous oxygenation by 13.8 +/- 1.1%. On the other hand, caffeine ingestion resulted in a decrease in oxygenation by 7.0 +/- 1.8%. Contrast agent infusion (Gd-DTPA, 0.1 mmol/kg) reduced venous blood T2 by 11.2 ms. The results of this study show that TRUST MRI is a useful technique for quantitative assessment of blood oxygenation in the brain.


Figures

Fig. 1
Fig. 1
TRUST MRI technique. (a) Pulse sequence diagram for TRUST MRI. The sequence consists of interleaved acquisitions of label and control scans, and each image type is acquired with four different eTEs ranging from 0 to 160 ms. For each scan, the sequence starts with a pre-saturation RF pulse to suppress the static tissue signal, followed by a labeling (or control) RF pulse to magnetically label the incoming blood. A brief waiting period (1.2 seconds) is allowed for blood to flow into the imaging slice. Before data acquisition, a non-selective T2-preparation pulse train is applied to achieve the T2-weighting, the duration of which is denoted eTE. The T2-preparation scheme, instead of conventional T2-weighted sequence, is used in order to minimize the blood outflow effect. (b) Geometric relationship between the imaging slice (yellow) and the labeling slab (green). Labeling slab thickness 50 mm, gap 25mm.
Fig. 2
Fig. 2
Simulations of magnetization evolvement in TRUST MRI. (a) Temporal evolvement of the different pools of spins for an experiment with an effective TE of 40ms (eTE=40 ms, τCPMG=10ms, Four 180º pulses). The brown bar indicates the start of the T2-prep, from which time the magnetization decays exponentially at the rate of T2. The curves plotted are the magnetizations that affect the MR signal during reception, showing the longitudinal magnetizations before the yellow bar and the transverse magnetizations after the yellow bar. Simulation parameters: TI=1200ms, T1,tissue=1165.5ms, T2,tissue=83.5ms, T2,tissue*=47.3ms, T1,blood=1624ms, T2,blood=54ms, T2,blood*=21ms. (b) Simulation of the difference signals for a set of experiments with different eTEs. The τCPMG is fixed at 10ms and the number of 180º pulses varies. The signals acquired are proportional to the magnetizations at the end of the curves (Time=1200ms).
Fig. 3
Fig. 3
An example of the TRUST MRI data. (a) MR images in which the venous blood is either magnetically labeled (Label, middle row) or unlabeled (Control, top row). Each type of image is acquired at four different T2-weightings, denoted by the effective TE (eTE). The bottom row is the subtracted image, Control-Label. The red rectangle indicates the ROI containing sagittal sinus. (b) The signals in the sagittal sinus in the difference image are fitted to a monoexponential function. Red symbols: experimental data. Black curve: fitting results. (c) The T2 value obtained from the curve fitting is converted to venous oxygenation (in %) based on a known relationship between oxygenation and blood T2.
Fig. 4
Fig. 4
Intra-session reproducibility of TRUST measurements. TRUST MRI experiments were performed five times at ten minute intervals within a one-hour scanning session. Each dataset was processed separately, i.e. ROIs were identified independently. Error bar indicates the standard error of estimated parameter as obtained from the goodness-of-fit assessment.
Fig. 5
Fig. 5
TI and TR dependences of TRUST MRI results. (a) TRUST MRI (eTE=0ms only) was performed using a range of TI values (from 200ms to 2600ms at 200ms of intervals). The signal intensities in the different images are plotted as a function of TI. The raw signal indicates the simple subtraction (Control-Label) without accounting for the effect of T1-related decay. The normalized signal denotes the signal after the correction (i.e. (Control-Label)/2/exp(−TI/T1,b)). Note that in this case, the decaying effect is relatively easy to model compared to ASL, as there is no spin exchange between blood and tissue. (b) TRUST MRI was performed using a range of TR values (from 1.5 to 8s at 0.5s of intervals). Each dataset is processed separately to obtain the blood T2 value, which is plotted as a function of TR. The error bars indicate the standard deviations across subjects.

References

    1. Kety SS, Schmidt CF. The Effects of Altered Arterial Tensions of Carbon Dioxide and Oxygen on Cerebral Blood Flow and Cerebral Oxygen Consumption of Normal Young Men. J Clin Invest. 1948;27:484–492. - PMC - PubMed
    1. Nagdyman N, Fleck T, Schubert S, Ewert P, Peters B, Lange PE, Abdul-Khaliq H. Comparison between cerebral tissue oxygenation index measured by near-infrared spectroscopy and venous jugular bulb saturation in children. Intensive Care Med. 2005;31:846–850. - PubMed
    1. Coles JP, Minhas PS, Fryer TD, Smielewski P, Aigbirihio F, Donovan T, Downey SP, Williams G, Chatfield D, Matthews JC, Gupta AK, Carpenter TA, Clark JC, Pickard JD, Menon DK. Effect of hyperventilation on cerebral blood flow in traumatic head injury: clinical relevance and monitoring correlates. Crit Care Med. 2002;30:1950–1959. - PubMed
    1. Haacke EM, Lai S, Reichenbach JR, Kuppusamy K, Hoogenraad FG, Takeichi H, Lin W. In vivo measurement of blood oxygen saturation using magnetic resonance imaging: a direct validation of the blood oxygen level dependent concept in functional brain imaging. Human Brain Mapping. 1997;5:341–346. - PubMed
    1. Fox PT, Raichle ME, Mintun MA, Dence C. Nonoxidative glucose consumption during focal physiologic neural activity. Science. 1988;241:462–464. - PubMed

Publication types