

Comparison of T(1) and T(2) metabolite relaxation times in glioma and normal brain at 3T
- PMID: 18666155
- PMCID: PMC3033227
- DOI: 10.1002/jmri.21453
Comparison of T(1) and T(2) metabolite relaxation times in glioma and normal brain at 3T
Abstract
Purpose: To measure T(1) and T(2) relaxation times of metabolites in glioma patients at 3T and to investigate how these values influence the observed metabolite levels.
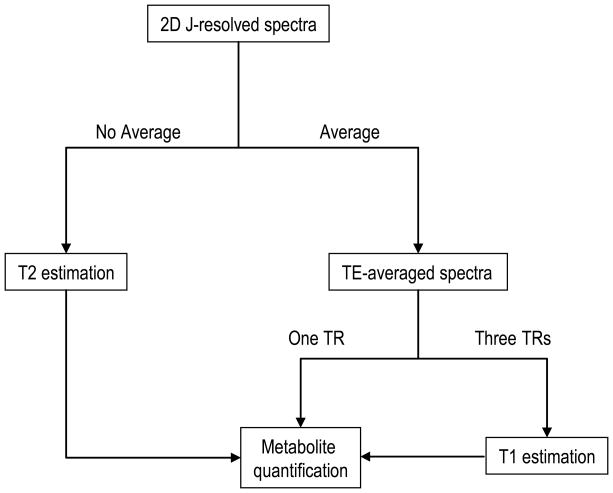
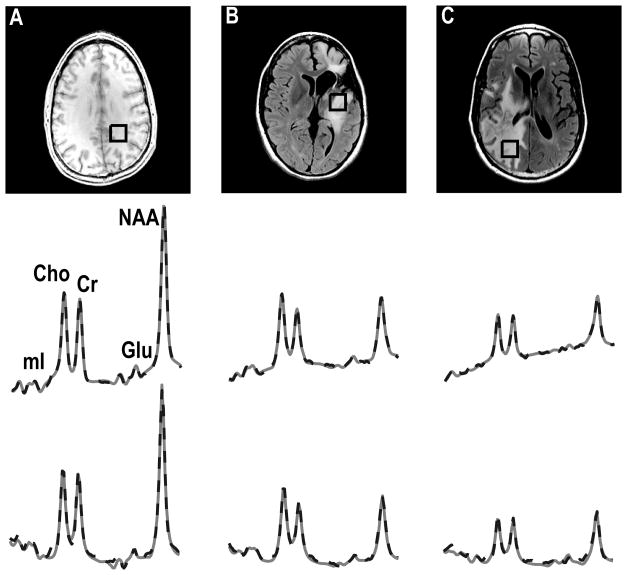
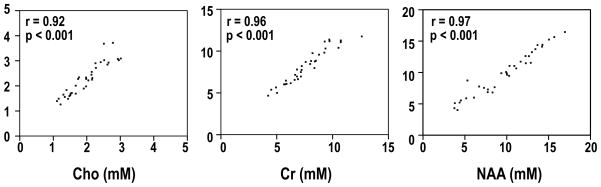
Materials and methods: A total of 23 patients with gliomas and 10 volunteers were studied with single-voxel two-dimensional (2D) J-resolved point-resolved spectral selection (PRESS) using a 3T MR scanner. Voxels were chosen in normal appearing white matter (WM) and in regions of tumor. The T(1) and T(2) of choline containing compounds (Cho), creatine (Cr), and N-acetyl aspartate (NAA) were estimated.
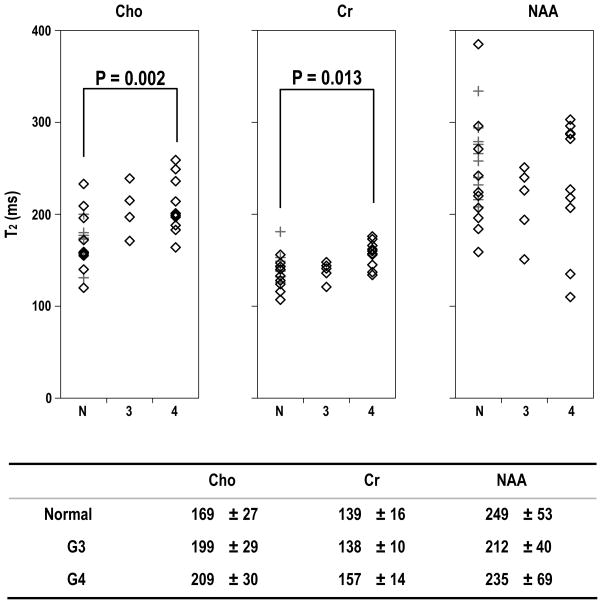
Results: Metabolite T(1) relaxation values in gliomas were not significantly different from values in normal WM. The T(2) of Cho and Cr were statistically significantly longer for grade 4 gliomas than for normal WM but the T(2) of NAA was similar. These differences were large enough to impact the corrections of metabolite levels for relaxation times with tumor grade in terms of metabolite ratios (P < 0.001).
Conclusion: The differential increase in T(2) for Cho and Cr relative to NAA means that the ratios of Cho/NAA and Cr/NAA are higher in tumor at longer echo times (TEs) relative to values in normal appearing brain. Having this information may be useful in defining the acquisition parameters for optimizing contrast between tumor and normal tissue in MR spectroscopic imaging (MRSI) data, in which limited time is available and only one TE can be used.
(c) 2008 Wiley-Liss, Inc.
Figures
References
-
- Gill SS, Thomas DG, Van Bruggen N, Gadian DG, Peden CJ, Bell JD, et al. Proton MR spectroscopy of intracranial tumours: in vivo and in vitro studies. J Comput Assist Tomogr. 1990;14:497–504. - PubMed
-
- Fulham MJ, Bizzi A, Dietz MJ, Shih HH, Raman R, Sobering GS, et al. Mapping of brain tumor metabolites with proton MR spectroscopic imaging: clinical relevance. Radiology. 1992;185:675–686. - PubMed
-
- Preul MC, Caramanos Z, Collins DL, Villemure JG, Leblanc R, Olivier A, et al. Accurate, noninvasive diagnosis of human brain tumors by using proton magnetic resonance spectroscopy. Nat Med. 1996;2:323–325. - PubMed
-
- Tong Z, Yamaki T, Harada K, Houkin K. In vivo quantification of the metabolites in normal brain and brain tumors by proton MR spectroscopy using water as an internal standard. Magn Reson Imaging. 2004;22:1017–1024. - PubMed
-
- Li Y, Osorio JA, Ozturk-Isik E, Chen AP, Xu D, Crane JC, et al. Considerations in applying 3D PRESS H-1 brain MRSI with an eight-channel phased-array coil at 3 T. Magn Reson Imaging. 2006;24:1295–1302. - PubMed
Publication types
MeSH terms
Substances
Grants and funding
LinkOut - more resources
Full Text Sources
Medical
