

Quantitative assessment of bone marrow edema-like lesion and overlying cartilage in knees with osteoarthritis and anterior cruciate ligament tear using MR imaging and spectroscopic imaging at 3 Tesla
- PMID: 18666183
- PMCID: PMC2666932
- DOI: 10.1002/jmri.21437
Quantitative assessment of bone marrow edema-like lesion and overlying cartilage in knees with osteoarthritis and anterior cruciate ligament tear using MR imaging and spectroscopic imaging at 3 Tesla
Abstract
Purpose: To quantitatively assess bone marrow edema-like lesion (BMEL) and the overlying cartilage in osteoarthritis (OA) or anterior cruciate ligament (ACL)-injured knees using magnetic resonance imaging (MRI) and spectroscopic imaging (MRSI).
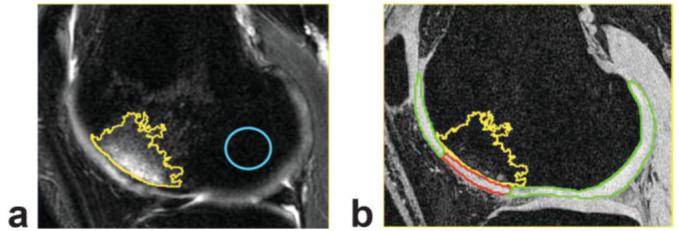
Materials and methods: Eight healthy controls and 30 patients with OA and other injuries who showed BMEL were scanned at 3.0T. A regression model was constructed to automatically calculate the volume of BMEL. Normalized T(1rho) z-scores were calculated within BMEL-overlying cartilage. Three-dimensional (3D) MRSI was acquired in the BMEL and surrounding bone marrow.
Results: The mean T(1rho) z-score was significantly higher in BMEL-overlying cartilage than that in surrounding cartilage in the lateral tibia of patients with ACL tears (P < 0.001). Significantly elevated water and unsaturated lipids, and decreased saturated lipids were observed in BMEL. The volume of elevated water correlated with the volume of BMEL. Water content was significantly higher within BMEL than that outside BMEL. The unsaturation index outside BMEL was significantly higher in patients with ACL tears than that in OA.
Conclusion: 3D MRSI and T(1rho) mapping provide tools to quantitatively evaluate BMEL in OA and knee injury. This may allow us to better understand pathophysiology and evolution of injuries and degenerative conditions of the knee.
(c) 2008 Wiley-Liss, Inc.
Figures


References
-
- Link TM, Steinbach LS, Ghosh S, et al. Osteoarthritis: MR imaging findings in different stages of disease and correlation with clinical findings. Radiology. 2003;226:373–381. - PubMed
-
- Felson DT, McLaughlin S, Goggins J, et al. Bone marrow edema and its relation to progression of knee osteoarthritis. Ann Intern Med. 2003;139(Pt 1):330–336. - PubMed
-
- Kornaat P, Bloem J, Ceulemans R, et al. Osteoarthritis of the knee: association between clinical features and MR imaging findings. Radiology. 2006;239:811–817. - PubMed
-
- Bretlau T, Tuxoe J, Larsen L, Jorgensen U, Thomsen HS, Lausten GS. Bone bruise in the acutely injured knee. Knee Surg Sports Traumatol Arthrosc. 2002;10:96–101. - PubMed
-
- Roemer FW, Bohndorf K. Long-term osseous sequelae after acute trauma of the knee joint evaluated by MRI. Skeletal Radiol. 2002;31:615–623. - PubMed
Publication types
MeSH terms
Grants and funding
LinkOut - more resources
Full Text Sources
Medical
