. 2008 Sep 15;68(11):1348-61.
doi: 10.1002/dneu.20668.

Mitochondrial biogenesis in the axons of vertebrate peripheral neurons

Affiliations

Mitochondrial biogenesis in the axons of vertebrate peripheral neurons

Mandana Amiri et al. Dev Neurobiol. .

Abstract

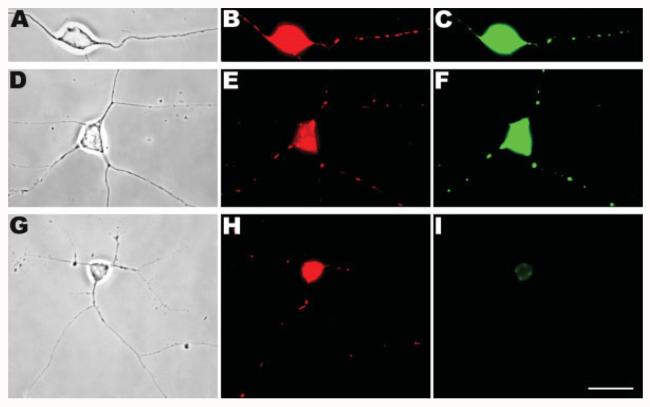
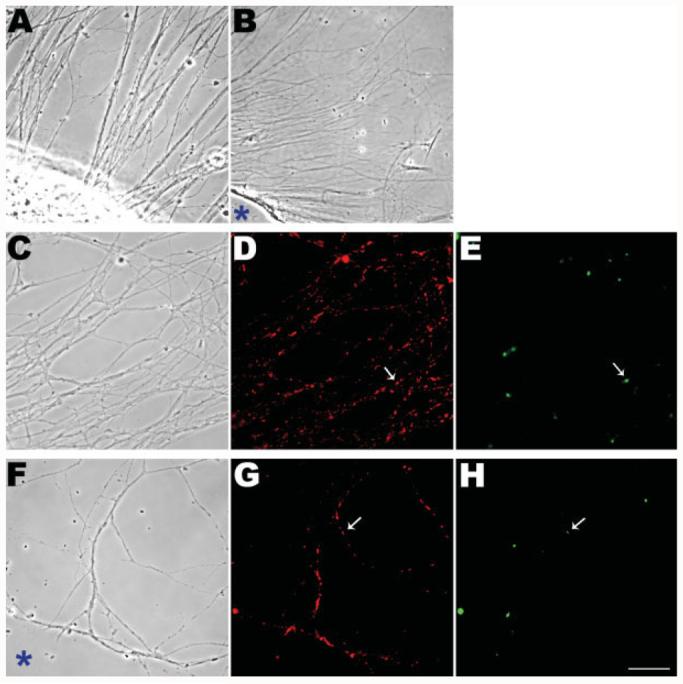
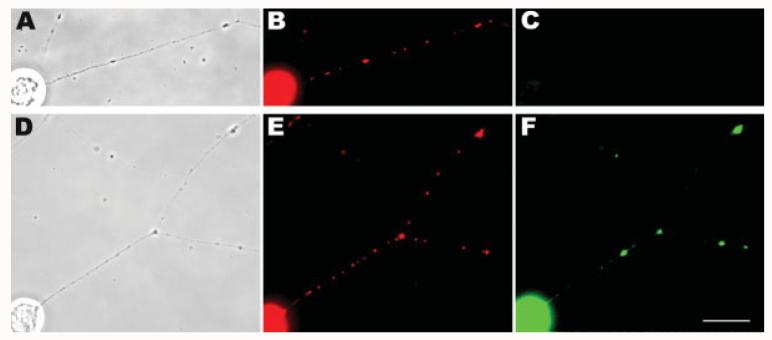
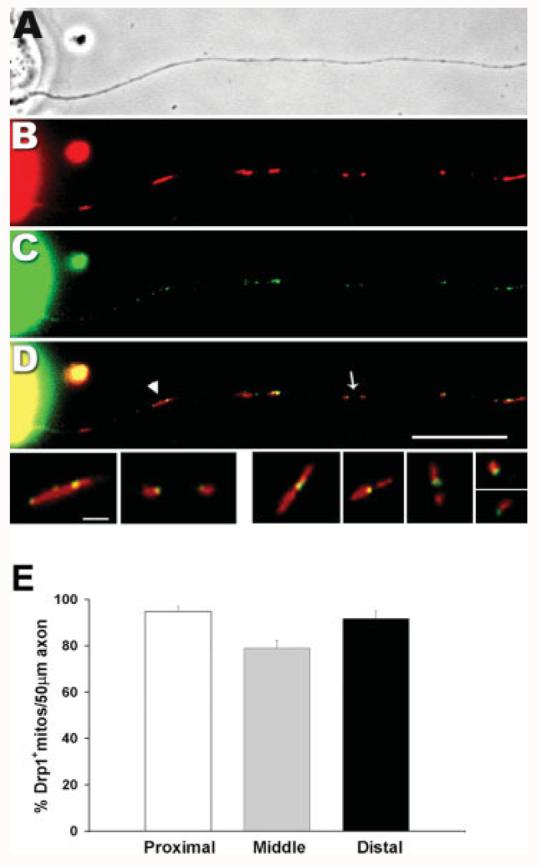
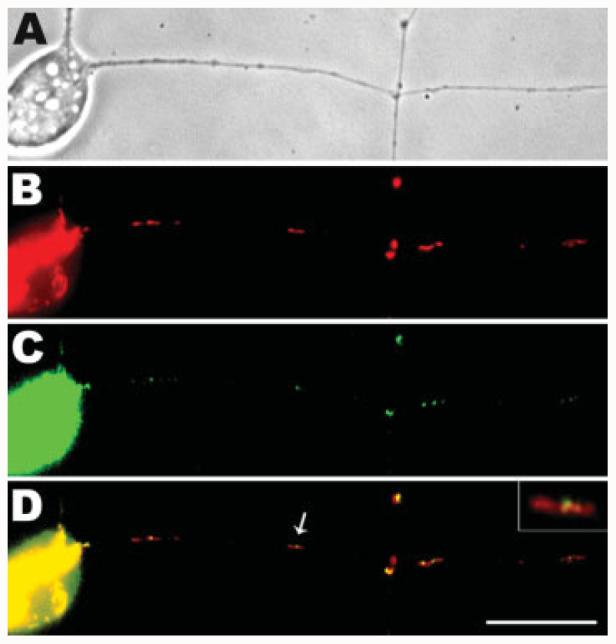
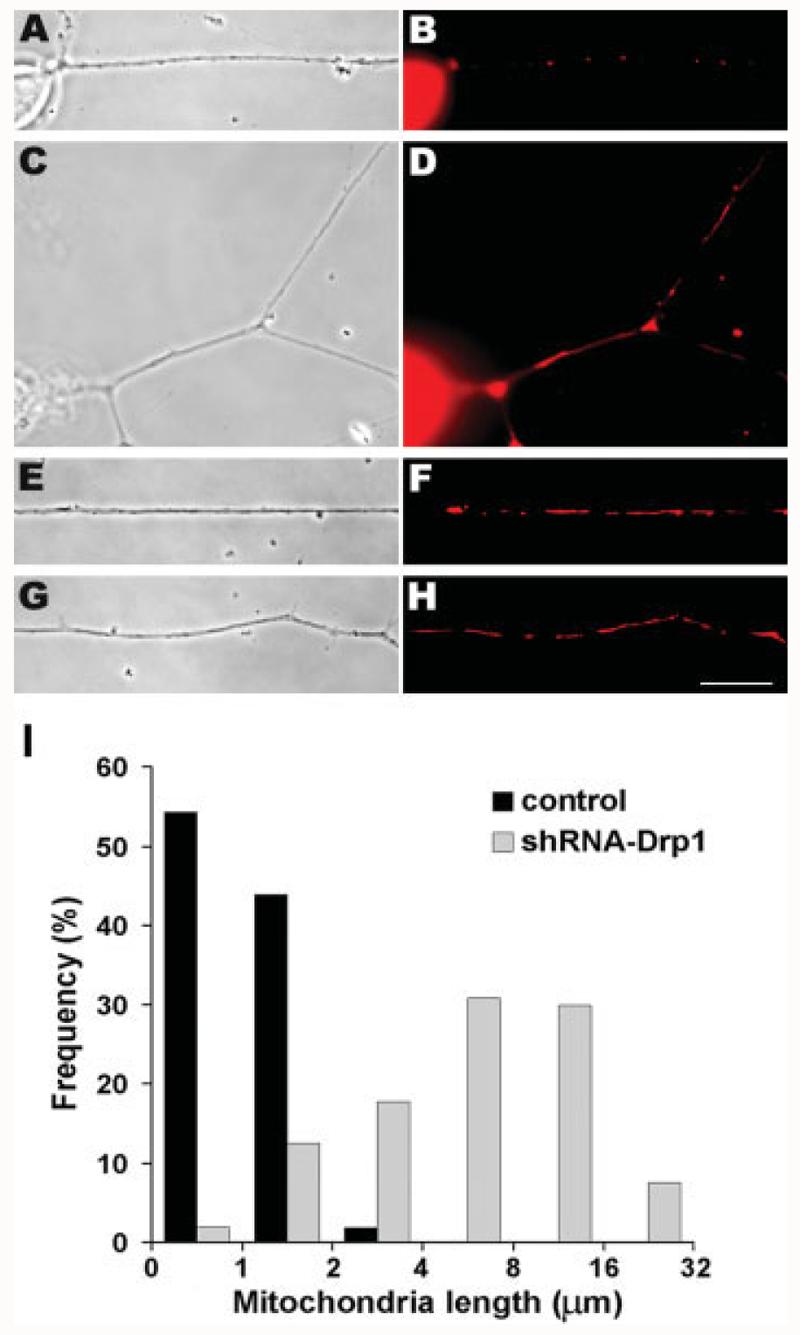
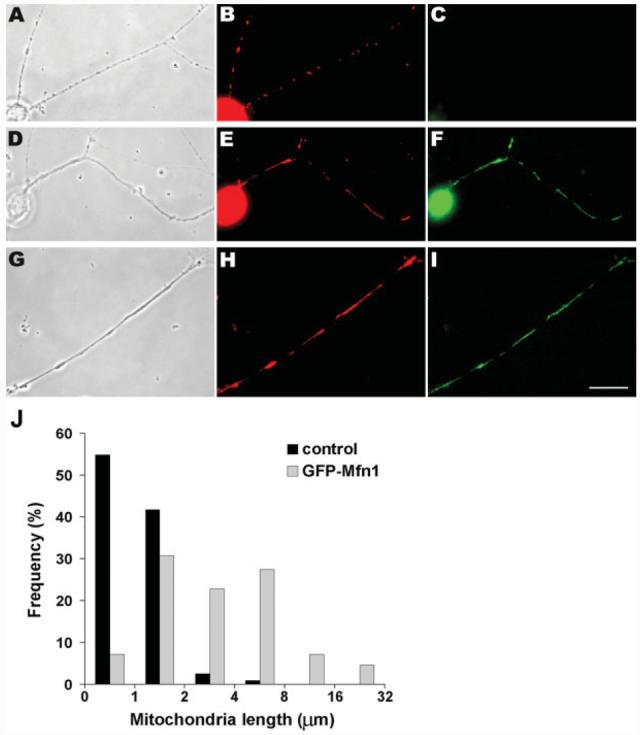
Mitochondria are widely distributed via regulated transport in neurons, but their sites of biogenesis remain uncertain. Most mitochondrial proteins are encoded in the nuclear genome, and evidence has suggested that mitochondrial DNA (mtDNA) replication occurs mainly or entirely in the cell body. However, it has also become clear that nuclear-encoded mitochondrial proteins can be translated in the axon and that components of the mitochondrial replication machinery reside there as well. We assessed directly whether mtDNA replication can occur in the axons of chick peripheral neurons labeled with 5-bromo-2'-deoxyuridine (BrdU). In axons that were physically separated from the cell body or had disrupted organelle transport between the cell bodies and axons, a significant fraction of mtDNA synthesis continued. We also detected the mitochondrial fission protein Drp1 in neurons by immunofluorescence or expression of GFP-Drp1. Its presence and distribution on the majority of axonal mitochondria indicated that a substantial number had undergone recent division in the axon. Because the morphology of mitochondria is maintained by the balance of fission and fusion events, we either inhibited Drp1 expression by RNAi or overexpressed the fusion protein Mfn1. Both methods resulted in significantly longer mitochondria in axons, including many at a great distance from the cell body. These data indicate that mitochondria can replicate their DNA, divide, and fuse locally within the axon; thus, the biogenesis of mitochondria is not limited to the cell body.


Figures

Figure 1
Figure 1
In situ detection of BrdU-incorporated mtDNA. Chick peripheral neurons were incubated with BrdU and the incorporation into mtDNA was detected by anti-BrdU immunocytochemistry. Phase contrast images (A,D,G), epifluorescence images of MitoTracker-labeled mitochondria (B,E,H), and of BrdU-labeled DNA (C,F,I) are shown here. After 15–20 h of labeling, BrdU signals were readily detected in mitochondria along the length of the axons (A–C). A similar pattern of BrdU localization was obtained even when the labeling period was decreased to 3 h (D–F). However, preincubation with ddC (G–I) resulted in no BrdU signals in the axons even after 15–20 h of BrdU staining and only a low level of background in the cell body (I). Note that due to the amplification with the double-precipitation procedure, the BrdU signals appeared to almost completely overlap with Mitotracker signals rather than being discrete foci within mitochondria. In addition, because of the immediate proximity to the cell body and long duration of BrdU exposure in (A–C), most of the mitochondria seen are BrdU-positive. Scale bar, 10 μm.
Figure 2
Figure 2
Mitochondria in axons can replicate their DNA in the absence of any connection to their cell bodies. Sympathetic ganglion explants that were grown for 2–3 days formed a radial halo of the axons (A). The cell body mass was surgically removed from ganglia 2 h prior to BrdU exposure (B). Cultures were incubated in BrdU for 3 h followed by fixation and immunocytochemical detection (C–H). BrdU signals were obvious in the axons of both intact ganglia (E) and those without cell bodies (H). Examples of BrdU signals corresponding to MitoTracker-stained mitochondria are shown by arrows in D and G. The sites of the removed cell body masses are shown with asterisks (B,F). Scale bar, 10 μm.
Figure 3
Figure 3
Mitochondrial DNA replication in axonal mitochondria after disruption of anterograde traffic by MT depletion. DRG cultures were grown overnight and then treated with vinblastine for 3 h. They were then grown for an additional 3 h in the absence (A–C) or presence of BrdU (D–F) and finally assayed by immunocytochemistry. The phase contrast (A,D), epifluorescence images of MitoTracker (B,E), and BrdU (C,F) staining are shown earlier. BrdU signals were detected along the axon of vinblastine-treated cells (F). No background signal was observed in the control cells which had not been labeled with BrdU (C). Scale bar, 10 μm.
Figure 4
Figure 4
Endogenous Drp1 is colocalized with mitochondria throughout the axon. Overnight DRG cultures were stained with MitoTracker (red, B), fixed, and subjected to anti-Drp1 immunostaining (C). Phase contrast (A) and epifluorescence (B–D) images are shown here. An overlay image (D) shows that Drp1 (in green) is colocalized with mitochondria (in red). Drp1 is concentrated in puncta that are either found along the length of mitochondria (arrow head) or concentrated at the tip of newly divided ones (arrow). Scale bar, 10 μm. The mitochondria marked in (D) are shown enlarged in the bottom row on the left with additional examples on the right. Scale bar for bottom row, 2 μm. Distribution of Drp1-containing mitochondria along the length of the axons (E). The percentage of mitochondria positive for Drp1 was calculated in three different regions of the axon: proximal (0–50 μm from the cell body); distal (0–50 μm from the growth cone); and middle (remainder of the axon shaft). The histogram shows the mean of three experiments ± SEM indicated as error bars (n = 17 axons). The fraction of mitochondria containing Drp1 is similar between proximal (95 ± 2.3%, n = 193 mitochondria) and distal regions (92 ± 3.2%, n = 200) but both are higher than the middle region (79 ± = 3.3%, n = 135) of the axon (p < 0.001, repeated measures ANOVA).
Figure 5
Figure 5
GFP-Drp1 is colocalized with axonal mitochondria in DRG neurons. Isolated DRGs were transfected with a GFP-Drp1 expression plasmid and observed after 48 h. Phase contrast (A) and epifluorescence (B–D) images are shown here. Mitochondria were marked by MitoTracker (red, B). As shown in the merged image (D), the expressed GFP-Drp1 was detected as green puncta (C) on the mitochondria. The mitochondrion indicated by the arrow in D is shown enlarged in the inset. This image shows that the Drp1 fission protein is concentrated near the midpoint of a relatively long mitochondrion. Scale bar, 10 μm.
Figure 6
Figure 6
RNAi-mediated knockdown of Drp1 expression results in significantly longer mitochondria in axons. Isolated DRGs were transfected with shRNA-Drp1 and cells were stained with MitoTracker dye to reveal mitochondrial morphology (B,D,F,H). Phase contrast (A,C,E,G) and epifluorescence (B,D,F,H) images show that most mitochondria in transfected cells (C–H) are longer than those in control cells (A,B). Long mitochondria are seen throughout the axons of transfected cells: in the proximal (C,D), middle (E,F), and distal (G,H) regions. Scale bar, 10 μm. Quantification of mitochondrial length change after RNAi knockdown of Drp1 expression (I). The lengths of axonal mitochondria were measured and plotted as a frequency distribution. The mitochondrial length distributions in control and transfected cells were nearly nonoverlapping, differing from each other with p < 0.001 (two-tail t test). In control cells, 98% of mitochondria were ≤2 μm, whereas in transfected cells, 86% of mitochondria were >2 μm long, and a small fraction exceeded 16 μm. Pooled data are shown from three experiments (shRNA: n = 107 mitochondria/13 axons; control: n = 163 mitochondria/12 axons).
Figure 7
Figure 7
Overexpression of Mfn1 fusion protein induces longer mitochondria throughout DRG axons. Isolated DRGs were transfected with EGFP-Mfn1 expression plasmids and observed 48 h later. Phase contrast (A,D,G) and epifluorescence (B,C,E,F,H,I) images are shown. MitoTracker staining reveals the mitochondrial morphology (B,E,H). Neurons expressing EGFP-Mfn1 (D–F, G–I) had significantly longer mitochondria in all regions of axons than did untransfected cells (A– C). Longer mitochondria are shown in the proximal (E) and distal (H) regions of the axons. Scale bar, 10 μm. Overexpression of Mfn1 protein by transient transfection results in significantly longer mitochondria in axons (J). In transfected cells, the length of the mitochondria was increased very significantly (p < 0.001; two-tail t test); a small percentage (4.6%) of axonal mitochondria exceeded 16 lm in length. Pooled data are shown from two experiments (transfected: n = 124 mitochondria/9 axons, control: n = 115 mitochondria/3 axons).

References

    1. Alvarez J, Giuditta A, Koenig E. Protein synthesis in axons and terminals: Significance for maintenance, plasticity and regulation of phenotype. With a critique of slow transport theory. Prog Neurobiol. 2000;62:1–62. - PubMed
    1. Berthold CH, Fabricius C, Rydmark M, Andersen B. Axoplasmic organelles at nodes of Ranvier. I. Occurrence and distribution in large myelinated spinal root axons of the adult cat. J Neurocytol. 1993;22:925–940. - PubMed
    1. Bindokas VP, Lee CC, Colmers WF, Miller RJ. Changes in mitochondrial function resulting from synaptic activity in the rat hippocampal slice. J Neurosci. 1998;18:4570–4587. - PMC - PubMed
    1. Bleazard W, McCaffery JM, King EJ, Bale S, Mozdy A, Tieu Q, Nunnari J, et al. The dynamin-related GTPase Dnm1 regulates mitochondrial fission in yeast. Nat Cell Biol. 1999;1:298–304. - PMC - PubMed
    1. Bristow EA, Griffiths PG, Andrews RM, Johnson MA, Turnbull DM. The distribution of mitochondrial activity in relation to optic nerve structure. Arch Ophthalmol. 2002;120:791–796. - PubMed

Publication types

MeSH terms