A new real-time PCR method to overcome significant quantitative inaccuracy due to slight amplification inhibition
- PMID: 18667053
- PMCID: PMC2533027
- DOI: 10.1186/1471-2105-9-326
A new real-time PCR method to overcome significant quantitative inaccuracy due to slight amplification inhibition
Abstract
Background: Real-time PCR analysis is a sensitive DNA quantification technique that has recently gained considerable attention in biotechnology, microbiology and molecular diagnostics. Although, the cycle-threshold (Ct) method is the present "gold standard", it is far from being a standard assay. Uniform reaction efficiency among samples is the most important assumption of this method. Nevertheless, some authors have reported that it may not be correct and a slight PCR efficiency decrease of about 4% could result in an error of up to 400% using the Ct method. This reaction efficiency decrease may be caused by inhibiting agents used during nucleic acid extraction or copurified from the biological sample. We propose a new method (Cy0) that does not require the assumption of equal reaction efficiency between unknowns and standard curve.
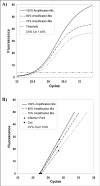
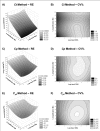
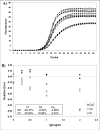
Results: The Cy0 method is based on the fit of Richards' equation to real-time PCR data by nonlinear regression in order to obtain the best fit estimators of reaction parameters. Subsequently, these parameters were used to calculate the Cy0 value that minimizes the dependence of its value on PCR kinetic. The Ct, second derivative (Cp), sigmoidal curve fitting method (SCF) and Cy0 methods were compared using two criteria: precision and accuracy. Our results demonstrated that, in optimal amplification conditions, these four methods are equally precise and accurate. However, when PCR efficiency was slightly decreased, diluting amplification mix quantity or adding a biological inhibitor such as IgG, the SCF, Ct and Cp methods were markedly impaired while the Cy0 method gave significantly more accurate and precise results.
Conclusion: Our results demonstrate that Cy0 represents a significant improvement over the standard methods for obtaining a reliable and precise nucleic acid quantification even in sub-optimal amplification conditions overcoming the underestimation caused by the presence of some PCR inhibitors.
Figures


Similar articles
-
Shape based kinetic outlier detection in real-time PCR.BMC Bioinformatics. 2010 Apr 12;11:186. doi: 10.1186/1471-2105-11-186. BMC Bioinformatics. 2010. PMID: 20385019 Free PMC article.
-
Accurate and precise DNA quantification in the presence of different amplification efficiencies using an improved Cy0 method.PLoS One. 2013 Jul 8;8(7):e68481. doi: 10.1371/journal.pone.0068481. Print 2013. PLoS One. 2013. PMID: 23861909 Free PMC article.
-
Revisiting the sigmoidal curve fitting applied to quantitative real-time PCR data.Anal Biochem. 2008 Feb 15;373(2):370-6. doi: 10.1016/j.ab.2007.10.019. Epub 2007 Oct 22. Anal Biochem. 2008. PMID: 17996715
-
[Quantitative PCR in the diagnosis of Leishmania].Parassitologia. 2004 Jun;46(1-2):163-7. Parassitologia. 2004. PMID: 15305709 Review. Italian.
-
The real-time polymerase chain reaction.Mol Aspects Med. 2006 Apr-Jun;27(2-3):95-125. doi: 10.1016/j.mam.2005.12.007. Epub 2006 Feb 3. Mol Aspects Med. 2006. PMID: 16460794 Review.
Cited by
-
Effect of Different Exercise Intensities on the Myotendinous Junction Plasticity.PLoS One. 2016 Jun 23;11(6):e0158059. doi: 10.1371/journal.pone.0158059. eCollection 2016. PLoS One. 2016. PMID: 27337061 Free PMC article.
-
Nationwide Trends in COVID-19 Cases and SARS-CoV-2 RNA Wastewater Concentrations in the United States.ACS ES T Water. 2022 Nov 11;2(11):1899-1909. doi: 10.1021/acsestwater.1c00434. Epub 2022 May 3. ACS ES T Water. 2022. PMID: 36380771 Free PMC article.
-
Shape based kinetic outlier detection in real-time PCR.BMC Bioinformatics. 2010 Apr 12;11:186. doi: 10.1186/1471-2105-11-186. BMC Bioinformatics. 2010. PMID: 20385019 Free PMC article.
-
Glycolytic competence in gastric adenocarcinomas negatively impacts survival outcomes of patients treated with salvage paclitaxel-ramucirumab.Gastric Cancer. 2020 Nov;23(6):1064-1074. doi: 10.1007/s10120-020-01078-0. Epub 2020 May 5. Gastric Cancer. 2020. PMID: 32372141 Free PMC article.
-
A fixed-point algorithm for estimating amplification efficiency from a polymerase chain reaction dilution series.BMC Bioinformatics. 2014 Dec 10;15(1):372. doi: 10.1186/s12859-014-0372-4. BMC Bioinformatics. 2014. PMID: 25492416 Free PMC article.
References
-
- Bustin SA, Mueller R. Real-time reverse transcription PCR (qRT-PCR) and its potential use in clinical diagnosis. Clin Sci (Lond) 2005;109:365–379. - PubMed
MeSH terms
Substances
LinkOut - more resources
Full Text Sources
Other Literature Sources
Miscellaneous

