Comparative Study
. 2008 Jul 31;59(2):214-25.
doi: 10.1016/j.neuron.2008.06.008.

Abeta plaques lead to aberrant regulation of calcium homeostasis in vivo resulting in structural and functional disruption of neuronal networks

Affiliations
Comparative Study

Abeta plaques lead to aberrant regulation of calcium homeostasis in vivo resulting in structural and functional disruption of neuronal networks

Kishore V Kuchibhotla et al. Neuron. .

Abstract

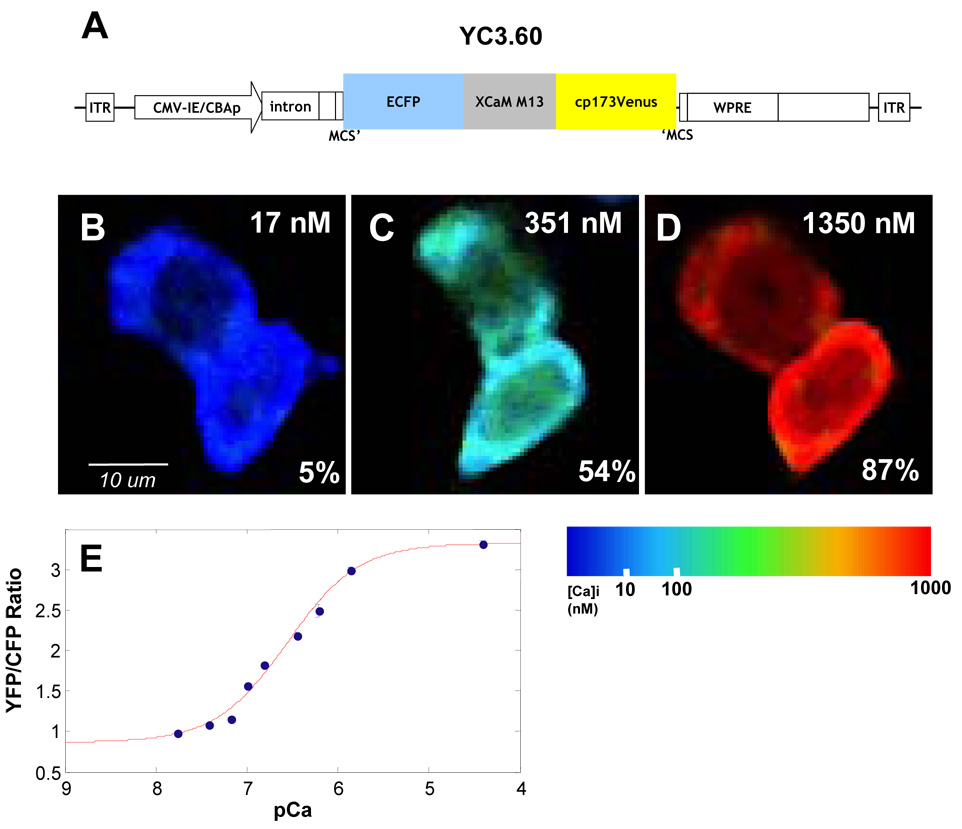
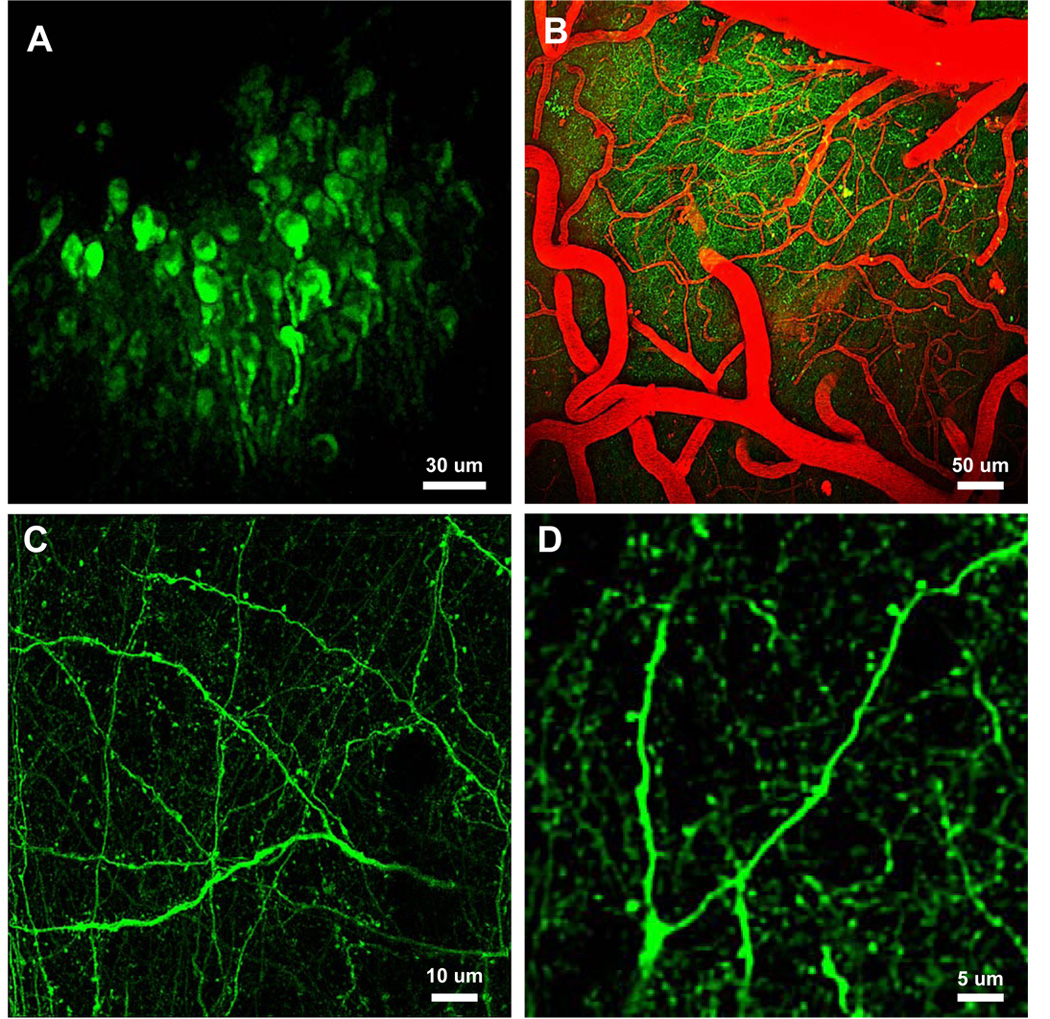
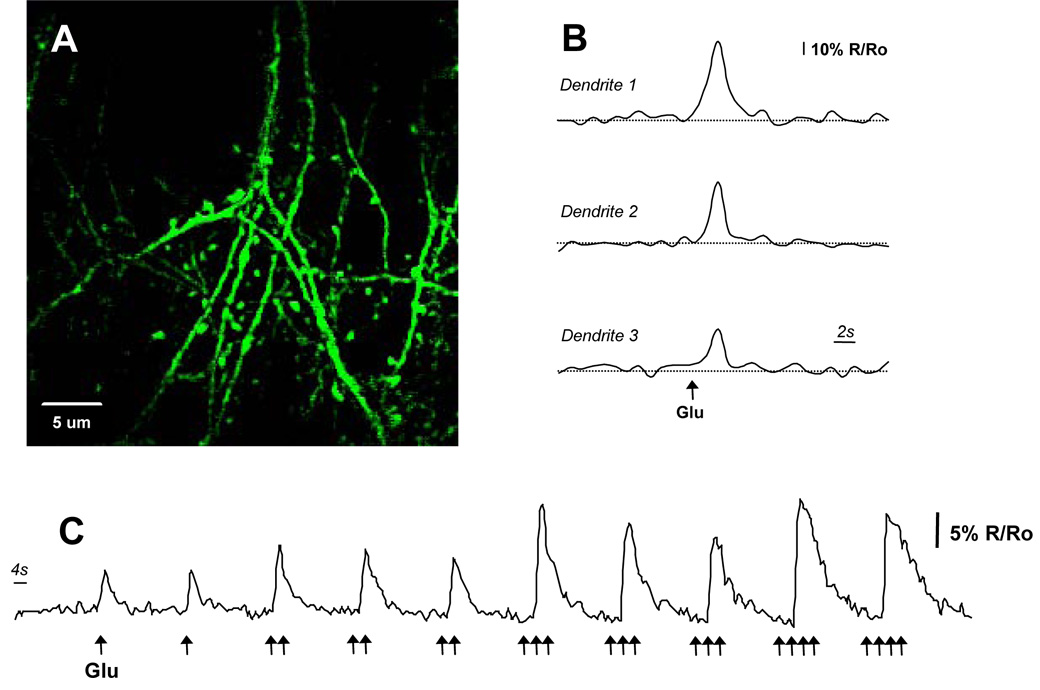
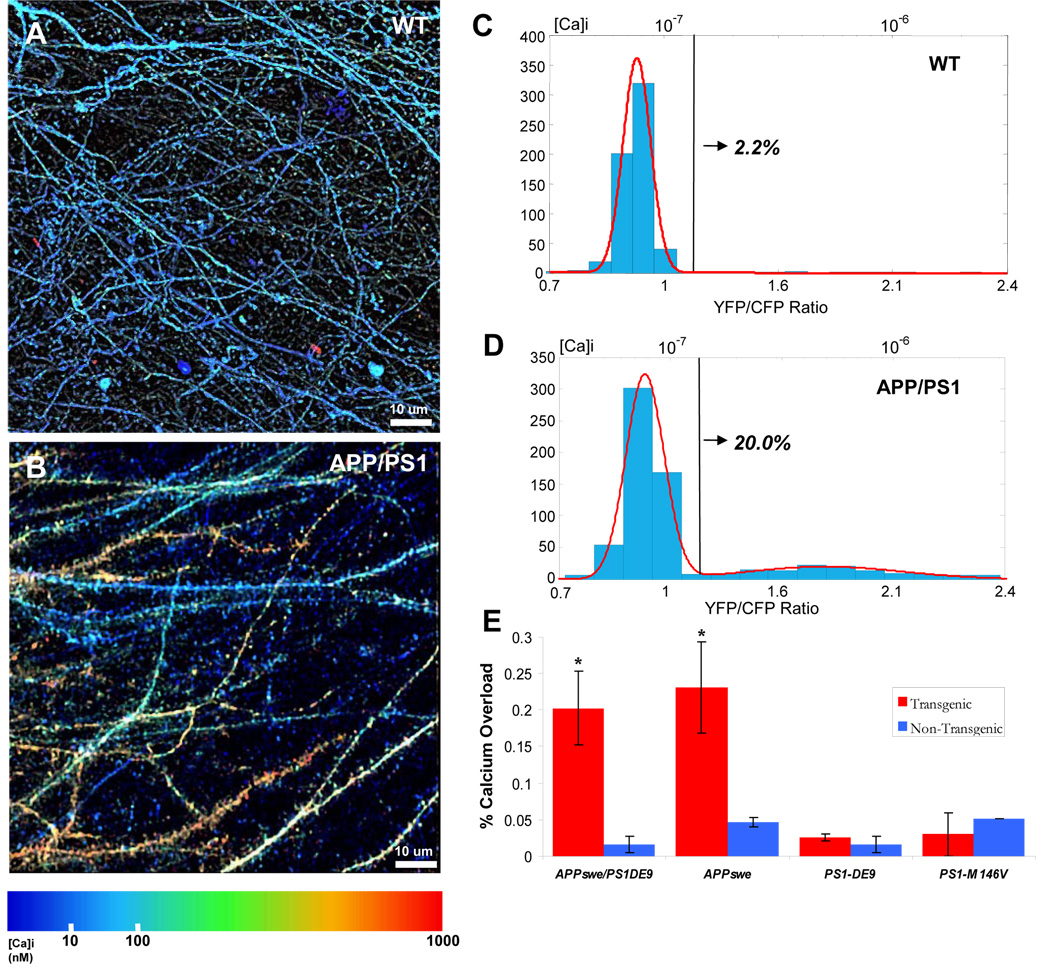
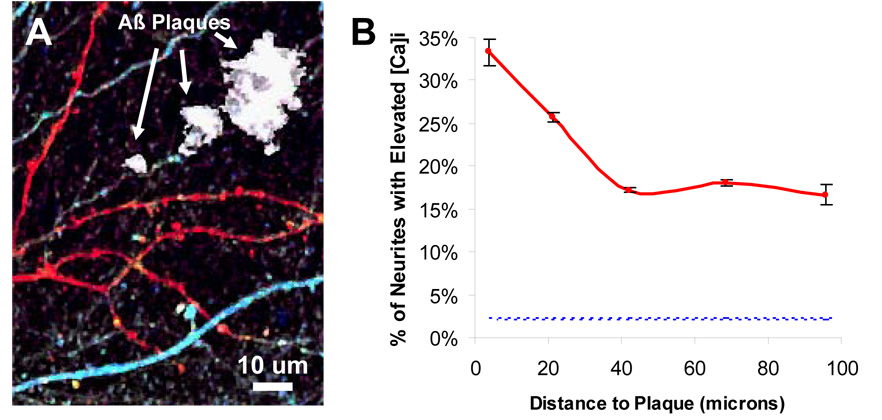
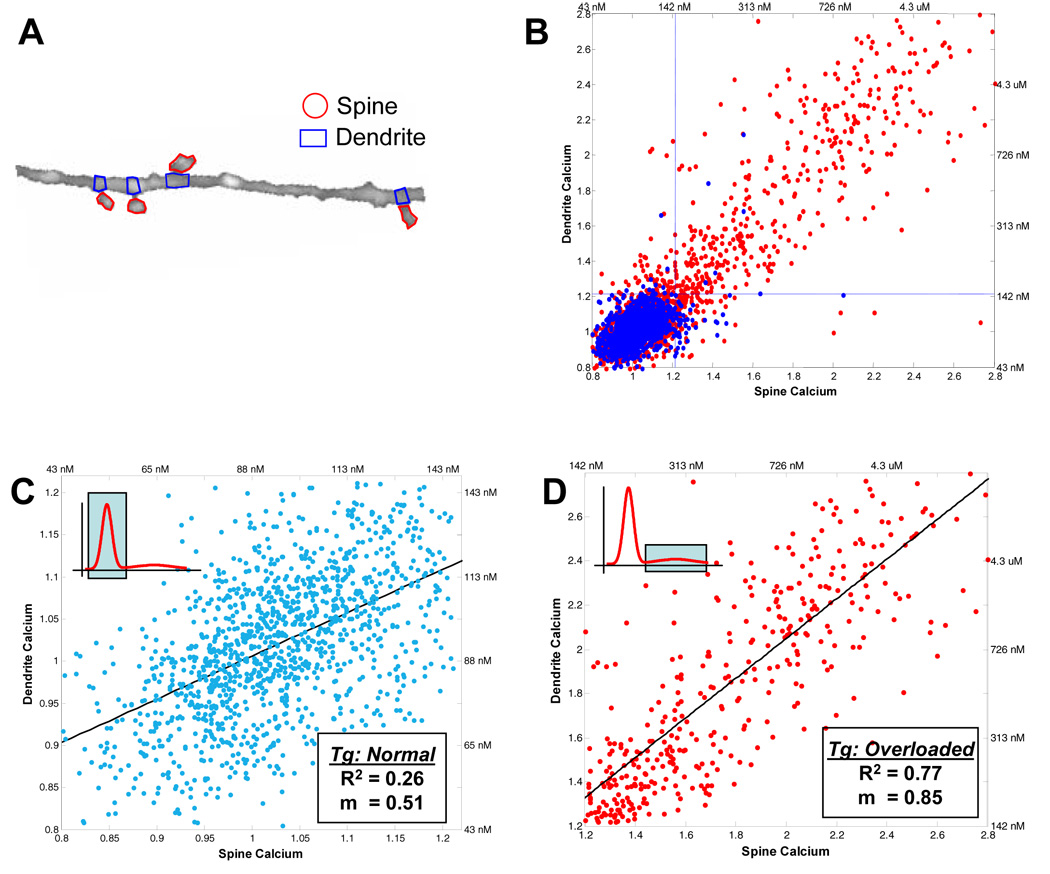
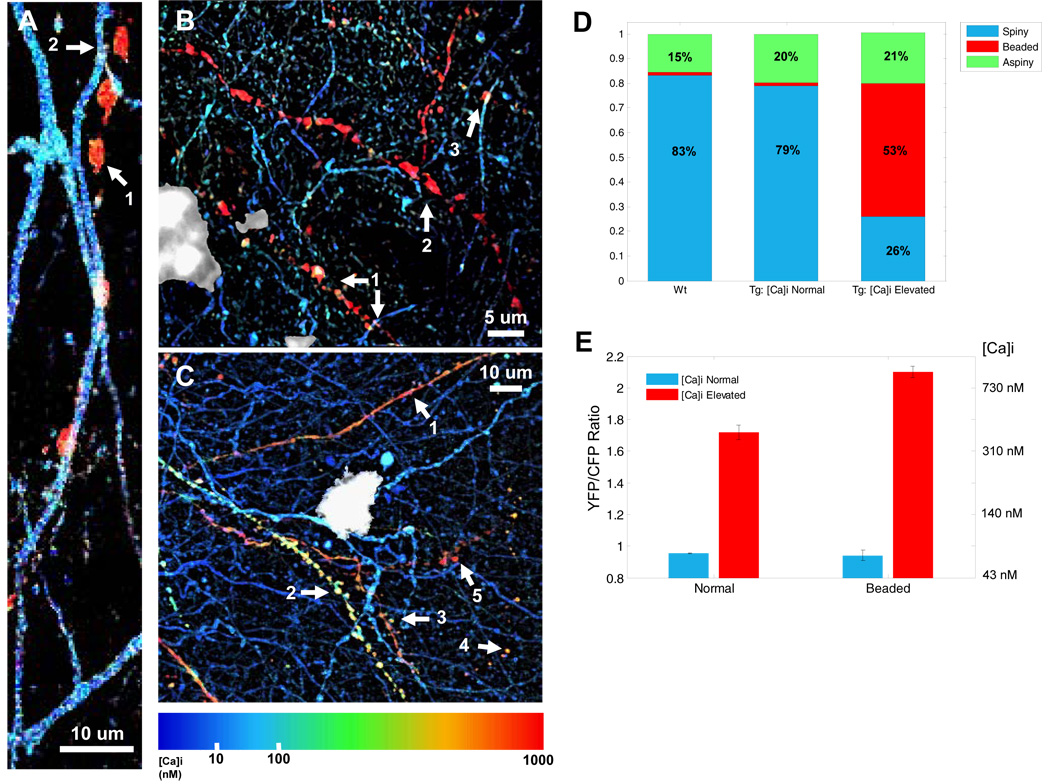
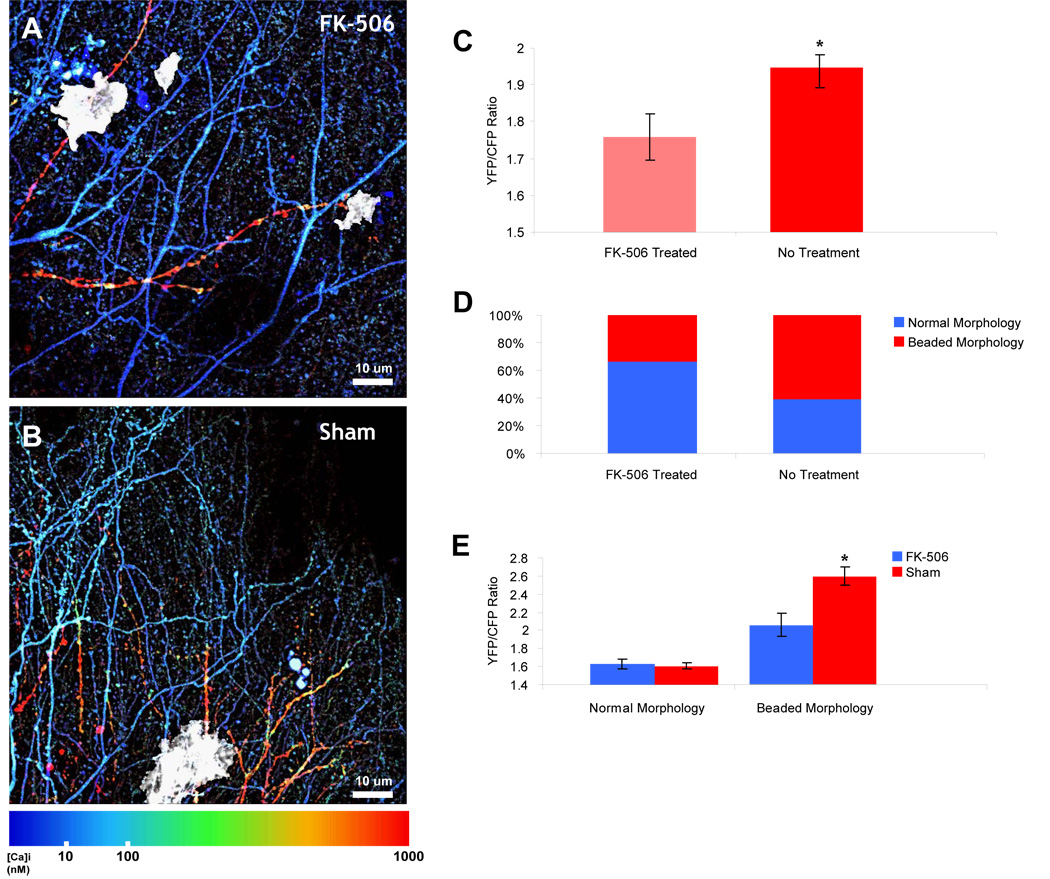
Alzheimer's disease is characterized by the deposition of senile plaques and progressive dementia. The molecular mechanisms that couple plaque deposition to neural system failure, however, are unknown. Using transgenic mouse models of AD together with multiphoton imaging, we measured neuronal calcium in individual neurites and spines in vivo using the genetically encoded calcium indicator Yellow Cameleon 3.6. Quantitative imaging revealed elevated [Ca(2+)]i (calcium overload) in approximately 20% of neurites in APP mice with cortical plaques, compared to less than 5% in wild-type mice, PS1 mutant mice, or young APP mice (animals without cortical plaques). Calcium overload depended on the existence and proximity to plaques. The downstream consequences included the loss of spinodendritic calcium compartmentalization (critical for synaptic integration) and a distortion of neuritic morphologies mediated, in part, by the phosphatase calcineurin. Together, these data demonstrate that senile plaques impair neuritic calcium homeostasis in vivo and result in the structural and functional disruption of neuronal networks.


Figures

Figure 1
Figure 1. Expression and calibration in CHO Cells
A) Diagram of construct pAAV-CBA-YC3.6-WPRE. See methods for details. B–D) CHO cells were incubated with varying [Ca], indicated in upper right corner, and ionomycin. Relative changes in YFP/CFP ratio are indicated as ΔR/ΔRmax in the bottom right corner. Images are pseudocolored according to the colorbar. E) Ca2+ titration curve of YC3.6 in CHO cells (number of observations: 0 nM = 1,088 cells; 17 nM = 395 cells; 38 nM = 484 cells; 65 nM = 712 cells; 100 nM = 1,223 cells; 150 nM = 1,518 cells; 351 nM = 425 cells; 602 nM = 144 cells; 1350 nM = 1,016 cells; 39 uM = 585 cells). Kd was determined to be 277 nm with a Hill coefficient of 1.1.
Figure 2
Figure 2. In vivo expression of YC3.6-AAV
A–D) In vivo multiphoton images deep in the neocortex of adult mice. A) Cell bodies 300–550 microns below the brain surface. B) Full field images of YC3.6-filled neuritis and fluorescent angiogram (red). C) High-resolution images of axons, dendrites and spines in layer I of a wildtype mouse. D) Higher magnification images of a dendritic tree and corresponding spines. Detailed analysis of cellular and sub-cellular morphology was possible with YC3.6.
Figure 3
Figure 3. In Vivo Imaging of Glutamate-evoked Ca2+ transients
A) High-resolution multiphoton image of dendrites and spines in vivo. The calcium response to micropipette injections of glutamate is described in trace (C). B) Dendrites from three different animals showing responses to small puffs of glutamate (10 mM). Calcium transients were measured as ΔR/R and averaged 56% ± 1% (n=16 dendrites). C) Peak calcium response and the decay constant increased with increased glutamate. Local glutamate concentration was approximated by co-injecting a red-fluorescent synthetic dye.
Figure 4
Figure 4. Calcium Overload in Neurites of APP/PS1 Transgenic Mice with Cortical Plaques
In vivo image of dendrites and axons in aged non-transgenic (A) and transgenic (B) mice. Images are pseudocolored according to [Ca2+]i. C–D) Histograms of [Ca2+]i (YFP/CFP ratio on lower x-axis and [Ca2+]i on upper x-axis). Tg mice had a distinct distribution (D)—modeled as the sum of two Gaussians (red line, r2=0.99)—compared to Non-Tg mice (C, single Gaussian, red line, r2=0.99 ). The black line corresponds to 2 standard deviations above the mean [Ca2+]i in non-Tg mice (147 nM)—above this line was classified as calcium-overloaded. 20.0% of neurites in Tg mice were overloaded compared to only 2.2% in non-Tg mice—a 10-fold increase (n= 3 mice in each group). E) A comparison of the percentage of calcium overloaded neurites across 4 different transgenic mouse lines. Only the APP/PS1 and the Tg-2576 (APPswe only) transgenic mice had significantly higher number of neurites with elevated calcium (*, p < 0.001, Chi-Squared test). PS1 mutant mice that did not exhibit plaques showed no appreciable calcium overload when compared to their respective controls (p = 0.77 for PS1-ΔE9 and p = 0.21 for PS1M146V). The PS1-ΔE9 mice are on the same background as the APP/PS1 transgenic mice—directly comparing the calcium overload between these mice and the APP/PS1 shows that the APP/PS1 mice that develop plaques have a significantly higher calcium overload (20.2% vs. 2.6%, p < 0.001, Chi-square test).
Figure 5
Figure 5. Aβ Plaques are a focal source of toxicity leading to calcium overload
A) In vivo image YC3.6 expressing dendrites and axons surrounding Aβ plaques (labeled in white). Elevated calcium was seen in neurites (in red) alongside neurites with normal calcium (in blue). B) Within 25 microns of a plaque, there was a significantly higher probability of finding a calcium overloaded neurite (p < 0.05, Fisher-Irwin test). The fraction of impaired neurites in non-Tg mice (2.2%) is shown as reference (blue-dotted line). Note that even far from a plaque, the percentage of calcium-overloaded neurites is much greater than in non-Tg mice.
Figure 6
Figure 6. Disrupted Spino-Dendritic calcium compartmentalization in mice with plaques
A) Dendritic spines were identified and regions of interest were drawn in ImageJ to isolate the spine from the dendritic compartment at the base of the spine. B) The spine calcium is plotted against the dendrite calcium for each spine-dendrite pair for spines from transgenic (red) and non-transgenic (blue) animals. The blue dotted lines demarcate the threshold for being calcium-elevated ([Ca2+]i > 147 nM). Unlike in the non-transgenic animals (blue), a large number of transgenic spines have a significantly elevated [Ca2+]i, consistent with data from dendrites and axons. C) The inset schematic highlights which part of the calcium distribution is being analyzed in the figure. Calcium is compartmentalized between normal-calcium spines and the local dendritic base—there was no statistically significant correlation between the spine vs. dendrite calcium (R2 = 0.26). C) Spine calcium is plotted against dendrite calcium for all elevated-calcium dendrites in the APP/PS1 mice. The inset highlights the part of the calcium distribution that is being analyzed. A strong correlation exists between the spine calcium and the associated dendritic compartment (R2 = 0.77) with a slope of 0.85 suggesting that the spine and dendrite are nearly completely coupled. Data are from n = 5 transgenic, n = 5 non-transgenic mice.
Figure 7
Figure 7. Calcium overload underlies distortions to neuritic morphologies
A) A [Ca2+]i-elevated “beaded” neurite (1) interdigitates with a morphologically, and functionally, normal dendrite (2). B) Beaded (1–3) neurites adjacent to a senile plaque (in white) exhibit high [Ca2+]i. C) Structurally intact spiny dendrites (1 – 3) and structurally compromised beaded neurites (4 and 5) adjacent to a senile plaque (in white) exhibit significantly elevated [Ca2+]i. D) The morphological breakdown of non-transgenic neurites matches that seen in [Ca2+]i normal neurites in transgenic mice. [Ca2+]i -elevated neurites, however, show a marked difference in morphological categorization. E). Resting [Ca2+]i differs between morphologically normal and abnormal neurites in the calcium-overloaded neurite population (p < 0.001, Mann-Whitney test).
Figure 8
Figure 8. Calcineurin Inhibition Prevents Neuritic Beading and Severe Calcium Overload
A) Pseudocolored multiphoton image of transgenic mouse treated with FK-506. Daily intraperitoneal injection of FK-506 (10 mg/kg) prevented the neuritic beading and severe calcium overload typically seen in APP/PS1 mice near plaques (in white). B) Multiphoton image of APP/PS1 mouse that was sham-treated. Moderate and severe calcium overloaded neurites surround a plaque with varying morphologies. C) In the calcium-overloaded neurites, there was a significant reduction in the resting calcium (p< 0.01, Mann-Whitney U-test). D) The reduction in [Ca2+]i can be explained by a reduction in the percentage of neurites that exhibit neuritic beading—only 33% of calcium-overloaded neurites exhibit a beaded and severe elevation of [Ca2+]i compared to 54% in sham-treatment (n = 3 mice in each group, n = 159 calcium-overloaded neurites, p < 0.05, Chi-Squared Test). E) Morphologically normal processes (spiny dendrites and aspiny processes) exhibit nearly the same [Ca2+]i in FK-506 treated or sham-treated mice (n = 82 neurites, p = 0.6807, students T-test) whereas there is a slight, but significant, reduction in the [Ca2+]i in those neurites with an abnormal morphology (n = 87 neurites, p < 0.05, student’s T-test).

References

    1. Akbari Y, Hitt BD, Murphy MP, Dagher NN, Tseng BP, Green KN, Golde TE, LaFerla FM. Presenilin regulates capacitative calcium entry dependently and independently of gamma-secretase activity. Biochem Biophys Res Commun. 2004;322:1145–1152. - PubMed
    1. Araya R, Eisenthal KB, Yuste R. Dendritic spines linearize the summation of excitatory potentials. Proceedings of the National Academy of Sciences. 2006;103:18799–18804. - PMC - PubMed
    1. Arispe N, Pollard HB, Rojas E. Giant multilevel cation channels formed by Alzheimer disease amyloid beta-protein [A beta P-(1–40)] in bilayer membranes. Proc Natl Acad Sci U S A. 1993a;90:10573–10577. - PMC - PubMed
    1. Arispe N, Rojas E, Pollard HB. Alzheimer disease amyloid beta protein forms calcium channels in bilayer membranes: blockade by tromethamine and aluminum. Proc Natl Acad Sci U S A. 1993b;90:567–571. - PMC - PubMed
    1. Bacskai BJ, Klunk WE, Mathis CA, Hyman BT. Imaging amyloidbeta deposits in vivo. J Cereb Blood Flow Metab. 2002;22:1035–1041. - PubMed

Publication types

MeSH terms

LinkOut - more resources