Comparative Study
. 2008 Jul 30;28(31):7765-73.
doi: 10.1523/JNEUROSCI.1296-08.2008.

Analog modulation of mossy fiber transmission is uncoupled from changes in presynaptic Ca2+

Affiliations
Comparative Study

Analog modulation of mossy fiber transmission is uncoupled from changes in presynaptic Ca2+

Ricardo Scott et al. J Neurosci. .

Abstract

Subthreshold somatic depolarization has been shown recently to modulate presynaptic neurotransmitter release in cortical neurons. To understand the mechanisms underlying this mode of signaling in the axons of dentate granule cells (hippocampal mossy fibers), we have combined two-photon Ca2+ imaging with dual-patch recordings from somata and giant boutons forming synapses on CA3 pyramidal cells. In intact axons, subthreshold depolarization propagates both orthodromically and antidromically, with an estimated length constant of 200-600 microm depending on the signal waveform. Surprisingly, presynaptic depolarization sufficient to enhance glutamate release at mossy fiber-CA3 pyramidal cell synapses has no detectable effect on either basal Ca2+-dependent fluorescence or action-potential-evoked fluorescence transients in giant boutons. We further estimate that neurotransmitter release varies with presynaptic Ca2+ entry with a 2.5-power relationship and that depolarization-induced synaptic facilitation remains intact in the presence of high-affinity presynaptic Ca2+ buffers or after blockade of local Ca2+ stores. We conclude that depolarization-dependent modulation of transmission at these boutons does not rely on changes in presynaptic Ca2+.


Figures

Figure 1.
Figure 1.
Dual-patch axon–soma recordings and Ca2+ imaging in dentate granule cells. A, Schematic showing positioning of the microscope objective and two patch pipettes (both used for stimulation and recording) with respect to dentate gyrus (DG). B, Characteristic examples of giant MF boutons traced from granule cell somata into area CA3 (Alexa Fluo 594 emission; λx = 800 nm). C, Example of a dual-patch experiment showing a patched soma (right) and a visible giant bouton (dashed arrow) and adjacent patch pipettes. D, Traces, Dual current recordings from a CA3 bouton and soma during orthodromic (left) and antidromic (right) action potentials (escape currents) induced by 2 ms depolarization pulses (orange or cyan lines, individual traces; red or blue lines, five trace average). E, A characteristic Ca2+ signal (line scan at 500 Hz; Fluo-4 emission channel) recorded from a loose-patched giant MF bouton in area CA3 in response to five action potentials generated at the soma. Arrows, Spike onsets; plot, the time course of fluorescence integrated over the width of the recorded bouton.
Figure 2.
Figure 2.
Subthreshold depolarization propagates in intact MFs between remote boutons and granule cell somata. A, Example of a dual-patch experiment (Fig. 1) showing somatic voltage deflection (blue, eight-trial average; converted from whole-cell current recording using input resistance) evoked by a 100 ms depolarizing pulse at a CA3 MF bouton (red), with the amplitude adjusted just below a spiking threshold; the latter was established earlier to be ∼+25 mV relative to the resting potential at these boutons (Geiger and Jonas, 2000). B, Antidromic (axon–soma) attenuation of a subthreshold depolarization wave in individual MFs: experimental data and theoretical estimates. Ordinate, Amplitude of somatic current deflection evoked by near-threshold depolarization (100 ms/25 mV) of axonal boutons (as in A); abscissa, soma–bouton distance. Red open circles, Data of dual-patch recordings (as in A); dotted line, the best fit with a single-exponent decay. Gray dots, Best-fit data obtained in simulation experiments mimicking dual-patch recordings in a detailed NEURON model of a granule cell (Schmidt-Hieber et al., 2007); optimization was achieved by adjusting the cable properties of the reconstructed axon, as detailed below in C. Inset, Simulated traces of somatic Vm in response to axonal subthreshold depolarization pulses at axon–soma distances shown in the plot. C, Testing axonal attenuation using a NEURON model of a fully reconstructed dentate granule cell adapted from (Schmidt-Hieber et al., 2007) (cell number 7, imported from SenseLab; ModelDB accession number 95960, http://senselab.med.yale.edu/modeldb). Left, A simulation example: antidromic (axon–soma) attenuation of the 100 ms/25 mV depolarization applied at the axonal site marked by a yellow arrow (resting Vm = −80 mV; false color scale, membrane voltage). The depolarization site was systematically changed and the (unknown) axonal properties were adjusted to obtain best fit for the experimental data, as shown in B, yielding intracellular resistivity Ri ≈ 50 Ω · cm and specific membrane resistance Rm ≈ 36.4 kΩ · cm2 (membrane capacitance, Cm ≈ 1 μF/cm2, and axon morphology were kept unchanged). Right, The best-fit model tested for orthodromic (soma-axon) attenuation in response to a square pulse, as shown; a simulation example. In the resulting model, the steady-state input resistance of MF boutons was 1.3–2.7 GΩ for distances from the soma ranging between 350 and 700 μm, respectively. D, Summary of simulation experiments: orthodromic attenuation of signal harmonics (frequency indicated) along the axon.
Figure 3.
Figure 3.
Maximal subthreshold depolarization of giant MF boutons has no effect on the presynaptic Ca2+ level. A, A traced and loose-patched giant MF bouton in CA3 (patch pipette is shown; Alexa Fluor 594 emission channel). Dashed arrows, Line-scan position; bottom, experiment diagram. B–D, Line scans of Ca2+-dependent Oregon Green BAPTA-1 fluorescence during suprathreshold (B, single spike initiation) and maximal subthreshold (C) depolarization pulses (blue segments) applied to the bouton (black and red lines in D, respectively; line-scan position shown in A). Subthreshold depolarization applied to the loose-patched bouton was simultaneously monitored as a voltage deflection at the soma, as shown in Figure 2A. E, Summary of dual-patch experiments showing average Ca2+-dependent fluorescence signals in response to suprathreshold and maximal subthreshold depolarization, as indicated (error bars indicate mean ΔF/F: 93 ± 29% and 1.1 ± 1.7%; n = 5 and n = 6, respectively; circles, individual data points).
Figure 4.
Figure 4.
Ca2+ entry in MF giant boutons controls synaptic responses in CA3 pyramidal cells with a power relationship of ∼2.5. A, Example traces of MF-evoked EPSCs in the same CA3 pyramidal cell (30 trace average) at [Ca2+]o = 2 mm (black) and 4 mm (red). B, Presynaptic Ca2+ transients evoked by an action potential in the same giant MF bouton in area CA3 (line scans, Fluo-4 channel; 10 trace average) at [Ca2+]o = 4 and 2 mm, as indicated (bottom, black and red lines, respectively); dashed arrows indicate the action potential onset. C, Summary relationship (n = 16) between the ΔF/F signal (open circles), total calculated Ca2+ entry (gray dots), and EPSC amplitude (relative to the amplitude at [Ca2+]o = 2 mm) at different [Ca2+]o values, as indicated. Error bars indicate SEM; red line, the best-fit power relationship y = AxB, where B = 2.5 ± 0.2 and A is a scaling factor. For further details, see Materials and Methods and supplemental Figure S2 (available at www.jneurosci.org as supplemental material).
Figure 5.
Figure 5.
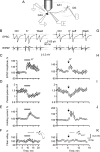
Presynaptic depolarization associated with raised [K+]o reversibly enhances the amplitude while decreasing the paired-pulse ratio of MF-evoked responses in CA3 pyramidal cells. A, Schematic showing positions of the stimulating electrode (stratum granulosum), patch-clamp pipette (bottom left), the extracellular recording electrode (top left), and the pressure-pulse pipette (middle; ∼20 mm K+ in bath solution). B, Whole-cell EPSCs (top traces) and fEPSPs (bottom traces) recorded, respectively, in CA3 pyramidal cells and in stratum lucidum, evoked by two stimuli (25 ms apart) applied in the granule cell layer (one-cell example). Ctrl, Control conditions; K+, [K+]o increased from 2.5–5 mm; Wash, washout. C–F, The average time course of the first EPSC amplitude (C; average change in high [K+]o, +54 ± 15%; n = 6; p < 0.001), the paired-pulse amplitude ratio (D; −31 ± 8%; p < 0.03), holding current (E; +24 ± 13%; p < 0.05) and the fiber volley amplitude [F; +15 ± 13%; not significant (NS)]. F, Inset, A characteristic fEPSP trace showing a fiber volley (arrow) in control conditions (black) and after an increase in [K+]o (gray). G–K, Same experiments as in B–F but with pressure application of K+ (100 ms/∼ 5 psi pulse; arrow) near the recorded CA3 pyramidal cell. Notation is as in B–F. The average changes after a high K+ puff (n = 9) are as follows: EPSC amplitude, +29 ± 10% (p < 0.03); paired-pulse ratio, −29 ± 8% (p < 0.01); holding current, +44 ± 34% (NS); fiber volley, −5 ± 6% (NS). Error bars indicate SEM.
Figure 6.
Figure 6.
Depolarization-induced enhancement of MF–CA3 pyramidal cell transmission is not affected by high-affinity buffering of presynaptic Ca2+. A, Bulk-loading granule cells with the high-affinity Ca2+ buffer BAPTA AM reduces the MF-evoked EPSCs in CA3 pyramidal cells to 27 ± 2% of baseline (top plot, mean ± SEM; n = 3) and action-potential-evoked ΔF/F responses to 48 ± 4% of baseline (bottom plot; black and open circles denote recording from dendrites and axons, respectively; combined, n = 7; imaged using 200 μm Fluo-4; error bars indicate average values). B, In the presence of bulk-loaded BAPTA AM (see A), depolarizing granule cell somata with local puffs of glutamate enhances the fEPSPs evoked by stimulation of MFs in CA3, with no change in fiber recruitment. Top left, Experiment schematic: an extracellular patch-pipette electrode in the dentate gyrus (DG) filled with the bath medium and glutamate (50 mm) is also connected to the micropump pressure line. Top traces, Extracellular recordings in the DG during alternating sweeps, with or without glutamate puff (black and gray, respectively); during and after the puff (open bar), an inward current deflection reflecting somatic depolarization is prominent, and pop spikes are seen indicating antidromic excitation of granule cells by extracellular stimuli in CA3. Bottom traces, fEPSPs recorded simultaneously in stratum lucidum (time scale expanded); during the puff (black), the fEPSP amplitude increases with no changes in fiber volley (fv; in these experiments, fEPSPs are relatively small compared with fv because of a strongly reduced release probability in the presence of BAPTA). Plots, Statistical summary; open circles, average ± SEM; n = 4; dotted lines, data from the same experiment; ***p < 0.005. C, In the presence of cytosolic BAPTA (as in A), an increase in [K+]o still decreases PPR (left; n = 5) and increases the amplitude (right; n = 4) of MF-evoked EPSCs in CA3 pyramidal cells (dotted line in the right plot indicates the amplitude reduction trend after bulk application of BAPTA AM; see A).
Figure 7.
Figure 7.
MF depolarization associated with raised [K+]o enhances transmission to CA3 pyramidal cells with no changes in presynaptic Ca2+ and no contribution from Ca2+ stores. A, Local increases in [K+]o have no effect on the resting Ca2+ level in individual giant MF boutons traced from granule cells; a characteristic one-bouton example. Left, A bouton is approached by a pressure application pipette (dotted lines; pipette medium, 30 mm KCl plus bath medium plus 20 μm Alexa Fluor 594; Alexa channel; arrow, line-scan position). Middle, Line scan (Alexa) illustrating the ejection flux profile (the brightness change front; no apparent mechanical disturbance can be seen in the bouton trace). Right, Line scan (OGB-1 channel) showing no detectable changes in the Ca2+-dependent fluorescence during the [K+]o rise. B, Summary. Increases in [K+]o have no effect on either resting or evoked Ca2+ signals in giant MF boutons. Black circles, Resting Ca2+ fluorescence (average change in high [K+]o, 1.0 ± 4.1%; n = 4); orange circles, spike-evoked ΔF/F Ca2+ signal (−1.2 ± 2.9%, n = 3) (for an example of recordings, see in Fig. 3A,B). Error bars indicate SEM. C, Increasing [K+]o to 5 mm in the presence of the Ca2+ store blocker thapsigargin reversibly reduces the PPR while increasing the amplitude of EPSCs in CA3 pyramidal cells (top and bottom plots, respectively); one-cell example. D, Summary of experiments in C: dotted lines connect data points from individual cells (n = 6; normalized to control values); bars, values averaged over the 5 min periods of control (Cntrl), increased [K+]o (5 mm K+), and washout (Wash), as indicated. **p < 0.01.
Figure 8.
Figure 8.
Somatic depolarization affects Ca2+ signaling only in proximal segments of granule cell axons. A, B, An example of tracing and identifying a giant CA3 bouton, with morphological reconstruction of the axon for soma–bouton distance measurements (Alexa channel). Two contiguous parts of the collage are connected by a yellow dotted line. The bouton of interest is shown by a gray rectangle and, at higher magnification, in B. C, A characteristic example illustrating no change in spike-evoked Ca2+ entry in a giant CA3 bouton (top line scan; plot, black trace) in response to somatic depolarization (bottom line scan; plot, red trace); blue segment, somatic depolarization from −80 to −45 mV; arrows, action potential onset. See additional examples in supplemental Fig. S3 (available at www.jneurosci.org as supplemental material). D–F, Effect of subthreshold somatic depolarization (100 ms pulse, 30–35 mV above the resting membrane potential) on presynaptic action-potential-evoked Ca2+ signals (D) and on the resting Ca2+-dependent fluorescence (E) decays rapidly along the axon; data in F show a similar effect of 100 mV, 200 ms somatic depolarization in the presence of 1 μm TTX. Abscissa, Distance to the soma; ordinate, relative changes in ΔF/F signal (D) or in the steady-state [Ca2+] calculated from fluorescence changes (E, F) (supplemental Fig. S3, available at www.jneurosci.org as supplemental material) (see Material and Methods for details). Blue and red circles, Fluo-4 and OGB-1 data, respectively; open circles, data obtained at 33–35°C; lines, a monoexponential fit.
Figure 9.
Figure 9.
Simulations predict that Ca2+ chelation (with EGTA) reduces spatial cooperativity among presynaptic Ca2+ nanodomains. A, B, A three-dimensional (spherical) fragment of the modeled presynaptic bouton (A; diameter, 1 μm; 0.2 μm segment truncated). Individual Ca2+ sources (voltage-dependent channels) were distributed in nine 50-nm-wide clusters, as depicted. In each cluster, Ca2+ influx followed the action-potential-driven kinetics (B) and an amplitude corresponding to the opening of nine channels letting through 125 ions each during an action potential (Koester and Sakmann, 2000). Bouton geometry or the size of channel clusters has little impact on the qualitative conclusion of these simulations. For additional parameters, see Materials and Methods. C, D, A simulation snapshot of the free Ca2+ concentration profile at the peak of action-potential-evoked Ca2+ influx in the plane normal (central cross-section; top) and parallel (the first 10 nm layer inside the terminal; bottom) to the synaptic membrane, before and after adding 10 mm EGTA (C, D, respectively). False color scale, Relative concentrations. E, Simulated near-membrane Ca2+ concentration landscape (relative values, scaled for comparison) showing spatial summation of Ca2+ domains generated by Ca2+ influx through Ca2+ channel clusters. Black and red lines, Before and after adding 10 mm EGTA, respectively. i, ii, Left (i) and right (ii) panels show the profile taken, respectively, along lines i and ii depicted in C and D. Vesicle diagram, Shortening the distance between the vesicle exocytosis trigger (gray spheres) and Ca2+ channels (blue rectangles) corresponds to a greater increase of Ca2+ concentration in the presence of EGTA (red lines) than without EGTA (black lines). For the underlying assumptions, see Materials and Methods.

References

    1. Acsády L, Kamondi A, Sik A, Freund T, Buzsáki G. GABAergic cells are the major postsynaptic targets of mossy fibers in the rat hippocampus. J Neurosci. 1998;18:3386–3403. - PMC - PubMed
    1. Alle H, Geiger JR. Combined analog and action potential coding in hippocampal mossy fibers. Science. 2006;311:1290–1293. - PubMed
    1. Alle H, Geiger JR. GABAergic spill-over transmission onto hippocampal mossy fiber boutons. J Neurosci. 2007;27:942–950. - PMC - PubMed
    1. Bischofberger J, Geiger JR, Jonas P. Timing and efficacy of Ca2+ channel activation in hippocampal mossy fiber boutons. J Neurosci. 2002;22:10593–10602. - PMC - PubMed
    1. Blatow M, Caputi A, Burnashev N, Monyer H, Rozov A. Ca2+ buffer saturation underlies paired pulse facilitation in calbindin-D28k-containing terminals. Neuron. 2003;38:79–88. - PubMed

Publication types