. 2008 Jun;20(6):1504-18.
doi: 10.1105/tpc.107.056903. Epub 2008 Jun 30.

Peeking into pit fields: a multiple twinning model of secondary plasmodesmata formation in tobacco

Affiliations

Peeking into pit fields: a multiple twinning model of secondary plasmodesmata formation in tobacco

Christine Faulkner et al. Plant Cell. 2008 Jun.

Abstract

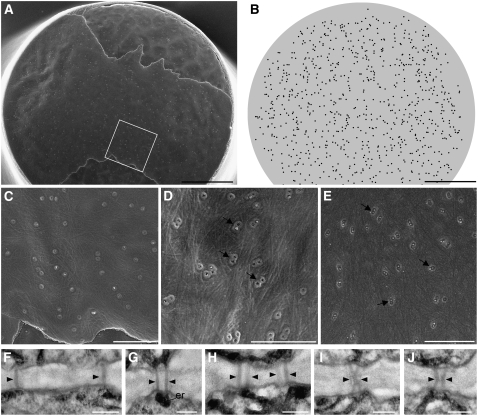
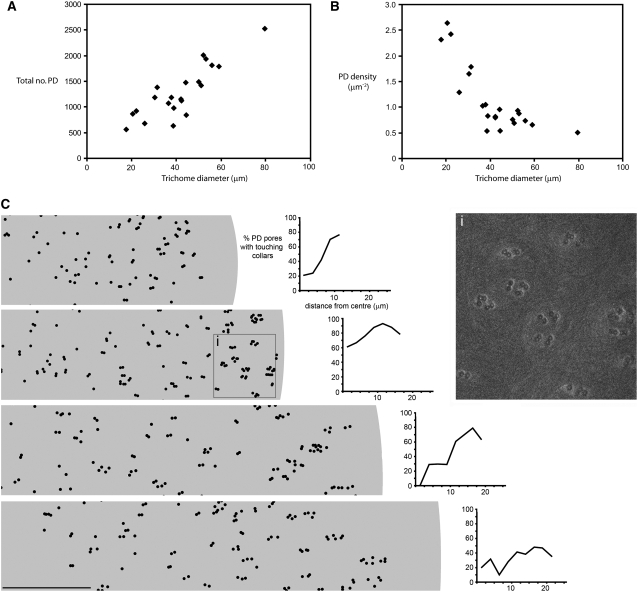
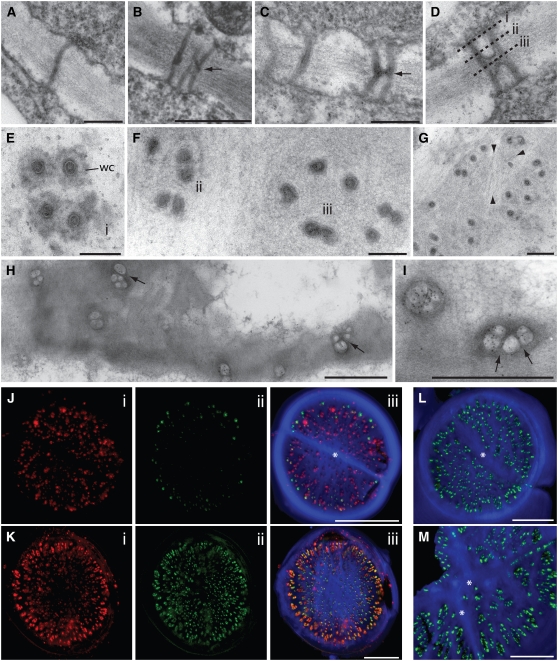
In higher plants, plasmodesmata (PD) are major conduits for cell-cell communication. Primary PD are laid down at cytokinesis, while secondary PD arise during wall extension. During leaf development, the basal cell walls of trichomes extend radially without division, providing a convenient system for studying the origin of secondary PD. We devised a simple freeze-fracture protocol for examining large numbers of PD in surface view. In the postcytokinetic wall, simple PD were distributed randomly. As the wall extended, PD became twinned at the cell periphery. Additional secondary pores were inserted at right angles to these, giving rise to pit fields composed of several paired PD. During wall extension, the number of PD increased fivefold due to the insertion of secondary PD. Our data are consistent with a model in which a subset of the original primary PD pores function as templates for the insertion of new secondary PD, spatially fixing the position of future pit fields. Many of the new PD shared the same wall collar as the original PD pore, suggesting that new PD pores may arise by fissions of existing PD progenitors. Different models of secondary PD formation are discussed. Our data are supported by a computational model, Plasmodesmap, which accurately simulates the formation of radial pit fields during cell wall extension based on the occurrence of multiple PD twinning events in the cell wall. The model predicts PD distributions with striking resemblance to those seen on fractured wall faces.


Figures

Figure 1.
Figure 1.
Freeze Fracturing of N. tabacum Leaf Trichomes. (A) Transgenic tobacco line expressing an MP-GFP fusion reveals the location of MP-targeted PD connecting the end walls of trichome cells. The basal trichome cell wall is indicated (arrow). MP-GFP is shown in green and chlorophyll autofluorescence in red. Bar = 20 μm. (B) Scanning electron micrograph showing the distribution of trichomes across the adaxial surface of a 2.5-cm-long leaf. A range of secretory trichomes is present. Large secretory trichomes (arrow) are distinguishable from smaller prostrate trichomes (arrowhead). Bar = 150 μm. (C) Leaf trichomes emerge from single epidermal cells. The main picture shows a scanning electron micrograph of a young leaf surface with emerging trichomes indicated with arrows. The inset shows a transmission electron micrograph of the developing cell plate between the basal trichome cell and the epidermis (arrowheads). Bar = 50 μm. (D) Schematic showing the fracturing protocols employed for trichome removal. (E) Fracture planes observed in the basal trichome wall. cw, cell wall. (F) Fractured basal wall of an MP-GFP trichome counterstained with Calcofluor white to reveal cellulose (blue). MP-GFP (green) associated with PD occurs in unstained (cellulose-deficient) pit fields in the cell wall. Bar = 20 μm. (G) Staining of pectin (green) within pit fields with the pectin-specific antibody LM6. Cellulose staining with calcofluor is shown in blue. Bar = 20 μm. (H) Fractured basal wall of an MP-GFP trichome imaged by FESEM. PD appear surrounded by raised wall collars. Cellulose microfibrils are visible on the surface of the wall. Bar = 2 μm. (I) Detail of the PM fracture surface. Wall microfibrils are seen as negative imprints. Bar = 1 μm. (J) Group of 11 PD pores showing prominent wall collars (wc) around the pores and desmotubules (d) within the pores. In some cases, a small piece of cortical ER covers the pore orifices. Bar = 0.5 μm. (K) Group of PD showing pores with attached desmotubules and other pores that appear empty (ep; see [E] for orientation) due to removal of the desmotubule during fracturing. wc, wall collar; d, desmotubule. Bar = 0.5 μm. (L) As in (K) but showing remnants of cortical ER associated with the necks of the pores. Bar = 0.5 μm. (M) to (O) PM fracture faces showing ER caps from the underlying cell associated with the neck of the PD pores and imprints of the wall collars (wci) on the PM surface. A ring of membrane, lighter in shade than the wall collar, is also visible around the wall collar imprints (arrows). d, desmotubule; ep, empty pore. Bar = 0.5 μm.
Figure 2.
Figure 2.
PD in the Basal Trichome Wall. (A) Fracture of the postcytokinetic cell plate, revealing fracture planes across both the wall and PM interfaces. Details of the boxed region are shown in (C). Bar = 5 μm. (B) PD locations of the trichome shown in (A) are mapped as black spots on the gray wall area. PD are randomly distributed. Bar = 5 μm. (C) Boxed region from (A) showing mostly discrete PD in the cell wall plane. Bar = 1 μm. (D) Twinned PD (arrows) visible in the cell wall fracture plane. Bar = 1 μm. (E) Twinned PD (arrows) visible in the PM fracture plane. Bar = 1 μm. (F) to (J) Twinned PD profiles viewed after ZIO fixation and thin sectioning. The electron-dense stain has accumulated in the cortical ER at the neck of the PD pores (arrowheads). Twinned PD profiles are shown in (I) and (J). Bar = 200 nm.
Figure 3.
Figure 3.
PD Distributions in Trichome Basal Cell Walls. (A) Relationship between trichome diameter and total number of PD per wall interface. Total number of PD per wall face increases with trichome diameter. (B) Relationship between trichome diameter and PD density. PD density is inversely proportional to trichome diameter. (C) Mapped positions of PD in FESEM transects of trichome walls of increasing diameter (bar = 5 μm). Graphs show the proportion of PD with contacting collars increasing from the center to the edge of the cell wall. The inset (i) shows the boxed region indicated in the second transect. Note the increased clustering of PD pores toward the perimeter of the extending cell wall.
Figure 4.
Figure 4.
Correlative FESEM and CLSM Imaging of PD Pit Fields. (A) PD within a single pit field are separated into three distinct groups. Note that PD remain closely twinned within the groupings. Bar = 0.5 μm. (B) and (C) Subdivision of PD within pit fields by oblique insertion of cellulose microfibrils (arrowheads). Bar = 1.5 μm. (D) and (E) Large basal cell walls showing prominent pit fields separated by new cell wall. (D) is a confocal laser scanning microscope projection of a fractured trichome wall stained with calcofluor (blue) to show cellulose. Note the extensive labeling of PD by MP-GFP (green) and the absence of PD from regions of wall connected to the walls between underlying epidermal cells (asterisk). (E) is a scanning electron micrograph of a fractured trichome wall showing the pit fields as sunken regions between the cellulose. Bars = 10 μm.
Figure 5.
Figure 5.
TEM and Immunolabeling of PD. (A) Transmission electron micrograph showing a simple PD pore in an immature trichome wall. Bar = 0.2 μm. (B) and (C) Development of H-shaped intermediates between adjacent PD pores (arrows). Bars = 0.5 μm in (B) and 0.2 μm in (C). (D) Development of a central cavity between two adjacent pores. The regions (i), (ii), and (iii) depict the neck region, mid wall, and central cavity regions, respectively. Bar = 0.2 μm. (E) Section through the neck region of PD pores showing wall collars (wc) corresponding to region (i) in (D). Note the elongated appearance of some of the pores. Bar = 0.1 μm. (F) Oblique section near mid region of wall showing areas similar to (ii) and (iii) in (D). Bar = 0.1 μm. (G) Oblique section of pit field showing cellulose microfibrils (arrowheads) separating groups of PD (cf. Figures 4B and 4C). Bar = 0.2 μm. (H) Glancing section through the mid wall region of pit fields showing extensive central cavities. Note that the central cavities are separated by distinct septa (arrows), giving them a segmented appearance in transverse section. Bar = 1.5 μm. (I) Enlargement of two central cavities showing strong immunogold labeling of MP-GFP. Wall septa are indicated (arrows). Bar = 1.5 μm. (J) and (K) Centripetal targeting of PD by MP-GFP (i, calreticulin antibody, red; ii, MP-GFP, green; iii, counterstainng with calcofluor, blue). In (J), the underlying epidermal cell has divided (asterisk) but MP-GFP targeting has just initiated. In (K), MP-GFP targeting of PD is complete and GFP and calreticulin signals mostly overlap. Bars = 10 μm. (L) and (M) Absence of MP-GFP labeling in regions of wall in which epidermal cell walls have fused with the trichome wall (asterisks). Bars = 10 μm.
Figure 6.
Figure 6.
Simulation Modeling of Secondary PD Formation. (A) The postcytokinetic wall is randomly seeded with PD at a distribution of 4 PD μm2 of wall at time = 0 h to generate the first frame of the Plasmodesmap simulation. The next two frames are at time point t = 190.1 h and t = 336 h, the endpoint of the simulation. Axes indicate the spatial coordinates of the trichome wall in micrometers with (0, 0) being the center. The boxed area is enlarged in (C). For full simulation, see Supplemental Movie 1 online. (B) Four time points (t = 0 h, t = 267.6 h, t = 297.1 h, and t = 336 h) from the Plasmodesmap simulation show the generation of two distinct pit fields from a single progenitor PD. Axes indicate the distance from the center of the trichome wall in micrometers, and the broken line represents the radius of the wall. For full simulation, see Supplemental Movie 2 online. (C) As the wall extends from 9 to 45 μm in diameter, secondary PD arise from fissions of existing PD, giving rise to discrete pit fields as seen in this enlargement of the boxed region of (A) (t = 336 h). (D) Plasmodesmap-generated PD clusters that bear a striking resemblance to PD formations seen in fractured wall faces (insets). The graphs are representations of PD formations generated by the computer simulation Plasmodesmap with the axes again indicating the distance from the center of the cell wall in micrometers and the broken line representing the radius of the wall. The insets are PD formations that were observed in scanning electron micrographs of fractured trichome basal cell walls.
Figure 7.
Figure 7.
Models of Secondary PD Formation. The top images show, from top to bottom, the PM fracture plane, TEM images of the neck region, and the wall fracture plane for putative stages in the formation of secondary PD pores. (A) Fission model. The diagram depicts the insertion of a second desmotubule into an elongated PD pore, creating two desmotubules within a shared pore orifice. With increasing wall extension, the new PD becomes separated from the original by increasing deposition of new wall microfibrils between the two pores. Central cavities may or may not form between the two pores, depending on the plant species in question (top and bottom panels). (B) De novo pore formation. The new PD pore is inserted immediately adjacent to the template pore by localized erosion of the cell wall. Two new desmotubules, each originating from a different cell, merge in the middle lamella region of the wall to form a complex structure. (C) Branched PD formation may result from either the fission model (A) or de novo pore formation (B). Twinned pores may or may not remain connected by ER in the middle lamella region of wall. Central cavities develop between interconnected PD as new pores are being formed.

References

    1. Angell, S.M., Davies, C., and Baulcombe, D.C. (1996). Cell-to-cell movement of potato virus X is associated with a change in the size exclusion limit of plasmodesmata in trichome cells of Nicotiana clevelandii. Virology 216 197–201. - PubMed
    1. Badelt, K., White, R.G., Overall, R.L., and Vesk, M. (1994). Ultrastructural specialisations of the wall sleeve around plasmodesmata. Am. J. Bot. 81 1422–1477.
    1. Baluska, F., Samaj, J., Napier, R., and Volkmann, D. (1999). Maize calreticulin localizes preferentially to plasmodesmata in root apex. Plant J. 14 481–488. - PubMed
    1. Barnett, J.R. (1987). Changes in the distribution of plasmodesmata in developing fibre-tracheid pit membranes of Sorbus aucuparia L. Ann. Bot. (Lond.) 59 269–279.
    1. Baskin, T. (2005). Anisotropic expansion of the plant cell wall. Annu. Rev. Cell Dev. Biol. 21 203–222. - PubMed