Comparative Study
. 2008 Aug 5;105(31):10961-6.
doi: 10.1073/pnas.0801496105. Epub 2008 Jul 30.

ESAT-6-specific CD4 T cell responses to aerosol Mycobacterium tuberculosis infection are initiated in the mediastinal lymph nodes

Affiliations
Comparative Study

ESAT-6-specific CD4 T cell responses to aerosol Mycobacterium tuberculosis infection are initiated in the mediastinal lymph nodes

William W Reiley et al. Proc Natl Acad Sci U S A. .

Abstract

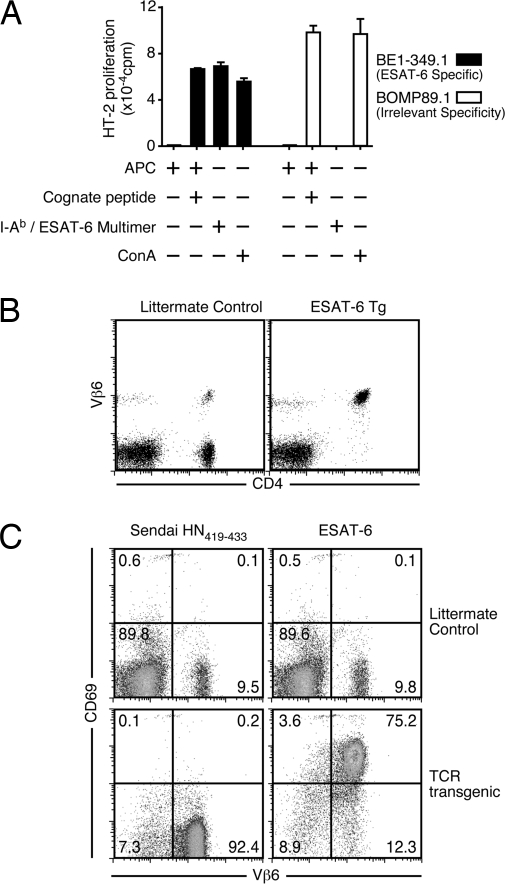
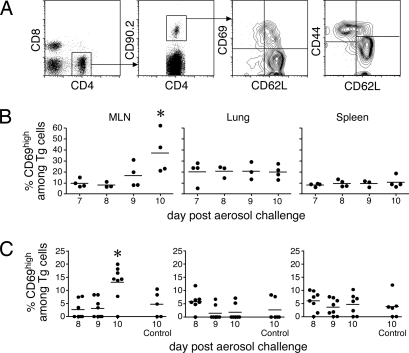
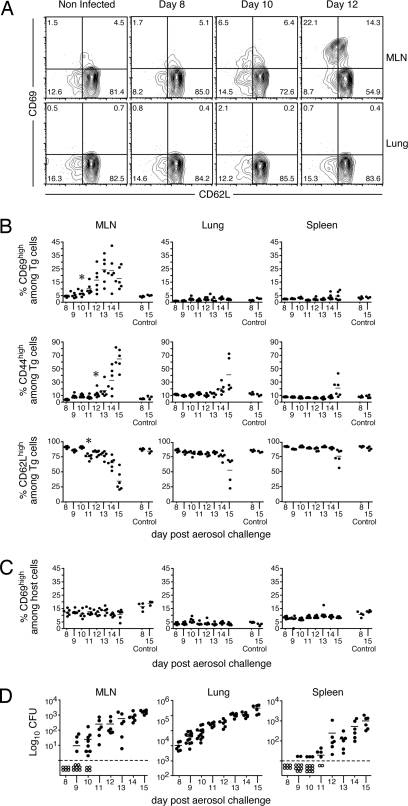
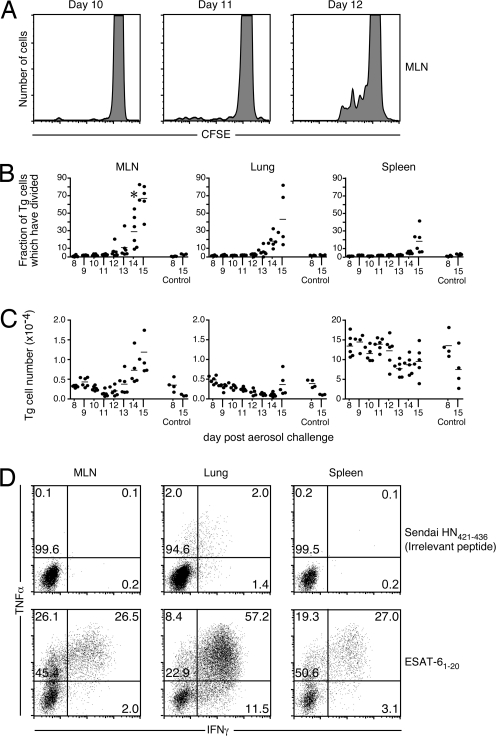
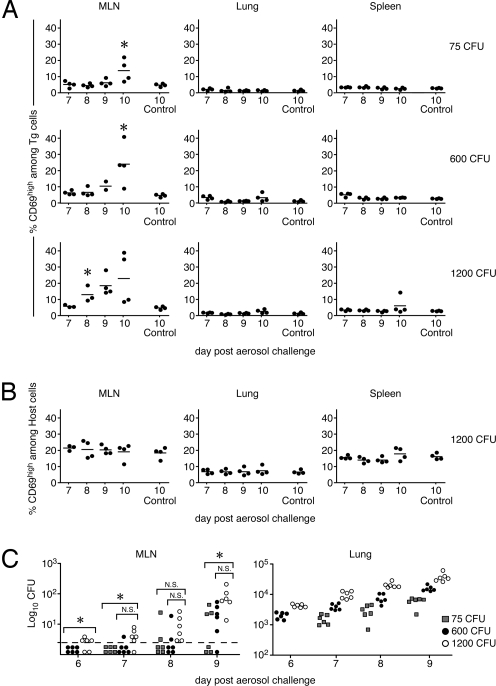
CD4(+) T cell responses to aerosol Mycobacterium tuberculosis (Mtb) infection are characterized by the relatively delayed appearance of effector T cells in the lungs. This delay in the adaptive response is likely critical in allowing the bacteria to establish persistent infection. Because of limitations associated with the detection of low frequencies of naïve T cells, it had not been possible to precisely determine when and where naïve antigen-specific T cells are first activated. We have addressed this problem by using early secreted antigenic target 6 (ESAT-6)-specific transgenic CD4 T cells to monitor early T cell activation in vivo. By using an adoptive transfer approach, we directly show that T cell priming to ESAT-6 occurs only after 10 days of infection, is initially restricted to the mediastinal lymph nodes, and does not involve other lymph nodes or the lungs. Primed CD4 T cells rapidly differentiated into proliferating effector cells and ultimately acquired the ability to produce IFN-gamma and TNF-alpha ex vivo. Initiation of T cell priming was enhanced by two full days depending on the magnitude of the challenge inoculum, which suggests that antigen availability is a factor limiting the early CD4 T cell response. These data define a key period in the adaptive immune response to Mtb infection.


Conflict of interest statement

The authors declare no conflict of interest.

Figures

Fig. 1.
Fig. 1.
Generation of an ESAT-61-20/I-Ab-specific TCR transgenic mouse. (A) The ESAT-61-20/I-Ab-specific T cell hybridoma BE1-349.1 or the irrelevant hybridoma BOMP89.1 was stimulated with splenic APCs alone, APCs plus cognate peptide, an ESAT-6/I-Ab multimer (Trudeau Institute), or the mitogen concanavilan A (ConA), as indicated. IL-2 production was determined by measuring 3H-thymidine incorporation by the IL-2-dependent cell line HT-2. (B) C57BL/6J littermates or C57BL/6J backcross progeny of transgenic founder mice were stained with antibodies against CD4 and Vβ6. The right dot plot is representative of the Vβ6 expression on CD4 T cells from a transgenic mouse. (C) Splenocytes from transgenic or littermate control mice were incubated for 24 h with spleen APCs plus Sendai HN419-433 or ESAT-61-20 peptides. The dot plots show up-regulation of CD69 expression on CD4-positive Vβ6-expressing transgenic T cells only after incubation with the specific peptide (upper right quadrant in bottom right plot).
Fig. 2.
Fig. 2.
Early activation occurred within 10 days after infection and was unaffected by donor T cell number. Naïve ESAT-6 transgenic cells (1 × 10⁶) were isolated by negative magnetic bead selection and injected i.v. into Thy1.1-congenic recipient mice 1 day before aerosol infection with 75 CFU of Mtb (strain H37Rv). Four mice were analyzed each day from day 7 through day 10 after infection. (A) Diagram of the flow cytometric gating strategy used to analyze CD69 and CD44 expression by the activated transgenic T cells. (B) Expression of CD69 on donor ESAT-6 transgenic T cells in the spleen, MLN, and the lung on the indicated days after infection. The data are representative of two independent experiments. (C) B6.SJL-Ptrpca+/− (F1)-congenic hosts were injected with naïve ESAT-6 transgenic cells (5 × 10⁴) on the day of aerosol infection. Expression of CD69 on donor ESAT-6 transgenic T cells in the MLN, spleen, and lung on the indicated days after infection is shown. (B and C) Data points are representative of individual mice. The horizontal bars indicate the mean of four to eight mice. The first days in which statistical significance was noted relative to control mice are indicated by asterisks. Statistical significance was determined by using the Student's t test (P ≤ 0.05).
Fig. 3.
Fig. 3.
Kinetics of ESAT-6/I-Ab-specific transgenic T cell activation during Mtb infection. Naïve ESAT-6 transgenic cells (2 × 10⁶) were injected into Thy1.1-congenic hosts that had been aerosol-infected 6 days earlier with 75 CFU of Mtb. Six mice were analyzed each day from day 8 through day 15 after infection. Four noninfected control mice were included on days 8 and 15 after infection (Control 8 and 15, respectively). The data are representative of three independent experiments of similar design. (A) Representative dot plots of CD69 and CD62L expression on CD4+/CD90.2+ transgenic T cells isolated from MLNs and lungs of uninfected and Mtb-infected mice on days 8, 10, and 12 after infection. (B) Expression of CD69, CD44, and CD62L on donor ESAT-6 transgenic T cells in the MLN, lung, and spleen. (C) Expression of CD69 on endogenous (host) CD4 T cells within the same animals analyzed in B. (D) Dissemination of Mtb after aerosol infection. Mice were killed, and the Mtb CFUs in the indicated tissues was determined. The open symbols below the dashed line indicate that no viable bacteria were detected within the entire organ homogenate. Data points are representative of individual mice. The horizontal bars indicate the mean of four to six mice. The first days in which statistical significance was noted relative to control mice are indicated by asterisks.
Fig. 4.
Fig. 4.
ESAT-61-20/I-Ab-specific transgenic T cells undergo differentiation and exhibit effector functions after Mtb infection. CFSE-labeled or unlabeled naïve ESAT-6 transgenic cells (2 × 10⁶) were i.v. administered on day 6 to recipients that had been aerosol-infected with 75 ± 25 CFU of H37Rv. (A) A representative histogram of CFSE expression on CD4+/CD90.2+ transgenic T cells in the MLN on days 9–12 after infection. (B) The fraction of transgenic T cells that had undergone cell division were determined on the basis on CFSE dilution. Data are presented from the spleens, MLNs, and the lungs of six mice analyzed on each day from days 8–15 after infection. Four noninfected control mice were included on days 8 and 15 after infection (Control 8 and 15, respectively). The data are representative of two independent experiments of similar design. (C) The number of transgenic cells shown in B are indicated. (D) Mice that received unlabeled naïve ESAT-6 transgenic cells were analyzed on day 15 after infection for the production of IFN-γ and TNF-α. Cells isolated from each tissue were stimulated with either an irrelevant peptide (Sendai HN421-436) or ESAT-61-20 for 6 h in the presence of brefeldin A. CD4+/CD90.2+ transgenic T cells are shown in the dot plots.
Fig. 5.
Fig. 5.
The timing of naïve T cell activation and bacterial dissemination depends on the size of the Mtb inoculum. Naïve ESAT-6 transgenic cells (2 × 10⁶) were i.v. injected into Thy1.1 congenic mice that had been aerosol-infected 5 days earlier with 75 ± 25, 600 ± 90, and 1,200 ± 200 CFU. (A) The expression of CD69 on donor ESAT-61-20/Ab transgenic T cells was analyzed in the MLN, lung, and spleen. (B) Expression of CD69 on host CD4 T cells in the high-inoculum-infected mice. The data are representative of two independent experiments of similar design and used three to six mice at each time point. Expression of CD69 on either host or transgenic CD4 T cells detected in individual Mtb-infected recipient mice is shown. (C) Mice were killed at the indicated times after infection, and the Mtb CFU in the indicated tissues was determined. The symbols indicate the CFU detected in each tissue after aerosol inoculation with 75 CFU (gray squares), 600 CFU (black circles), and 1200 CFU (white circles). Each datum represents a single mouse. Symbols below the horizontal dashed line indicate that viable bacteria were not detected within the entire organ homogenate. The asterisks are representative of statistical significance examined on each day between groups by using one-way ANOVA (P ≤ 0.05). Statistically significant differences in lung bacterial burden between the groups were observed on each day after infection.

References

    1. Maartens G, Wilkinson RJ. Tuberculosis. Lancet. 2007;370:2030–2043. - PubMed
    1. Raviglione MC, Smith IM. XDR tuberculosis—Implications for global public health. N Engl J Med. 2007;356:656–659. - PubMed
    1. North RJ, Jung YJ. Immunity to tuberculosis. Annu Rev Immunol. 2004;22:599–623. - PubMed
    1. Chackerian AA, Alt JM, Perera TV, Dascher CC, Behar SM. Dissemination of Mycobacterium tuberculosis is influenced by host factors and precedes the initiation of T-cell immunity. Infect Immun. 2002;70:4501–4509. - PMC - PubMed
    1. Wolf AJ, et al. Initiation of the adaptive immune response to Mycobacterium tuberculosis depends on antigen production in the local lymph node, not the lungs. J Exp Med. 2008;205:105–115. - PMC - PubMed

Publication types

Substances