

doi: 10.1038/leu.2008.196.
Epub 2008 Jul 31.
Rac guanosine triphosphatases represent a potential target in AML
- PMID: 18668135
- PMCID: PMC4185433
- DOI: 10.1038/leu.2008.196
Item in Clipboard
Rac guanosine triphosphatases represent a potential target in AML
Leukemia.
2008 Sep.
No abstract available
Figures
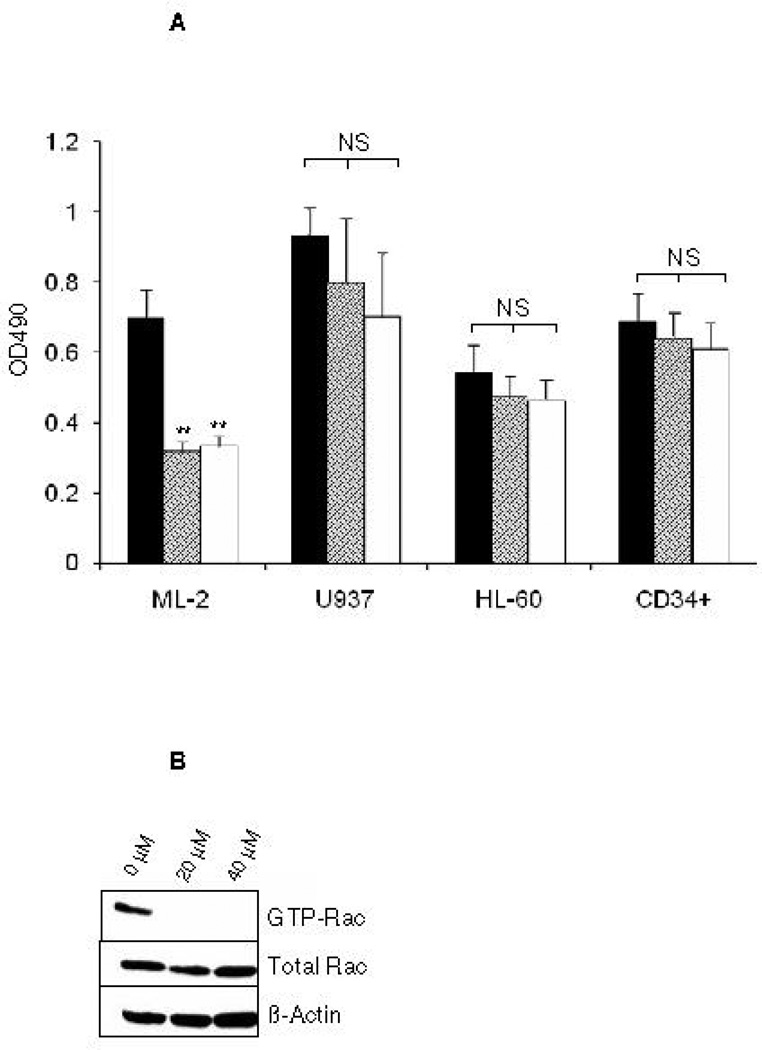
The Rac-specific inhibitor NSC23766 significantly impacts proliferation, survival, and cell cycle progression of human AML cell lines. (A) Proliferation of a panel of AML cell lines was analyzed by MTS assay 72 hrs after exposure to increasing doses of NSC23766 (n=3, 24 wells per condition). Black bars indicate 0 µM, hatched bars 20 µM, and white bars 40 µM NSC23766. (B) NSC23766 inhibits Rac activation in ML-2 cells. ML-2 cells were cultured in the presence of increasing doses of NSC23766. Lysates were analyzed for active, GTP-Rac. As controls, total lysates were analyzed for Rac and actin expression. (C) Apoptosis of ML-2 and CD34+ cells was analyzed 72 hours after exposure to NSC23766. Left panel depicts a representative dot blot analysis. Numbers indicate percentage of cells per quadrant. Graph depicts percentage of 7AAD-positive cells after exposure to 0 µM (black bars), 20 µM (hatched bars), or 40 µM (white bars) NSC23766 (n=5). (D) Cell cycle analysis of ML-2 and CD34+ cells was performed 48 hours after exposure to NSC23766. Left panel depicts representative dot blot after exposure to 0 or 40 µM NSC23766. Graph depicts percentage of cells in G1/G0 or S phase of cell cycle 48 hours after exposure to 0 µM (black bars) or 40 µM (white bars) NSC23766, respectively (n=5). ** p<0.01, NS = not significant.
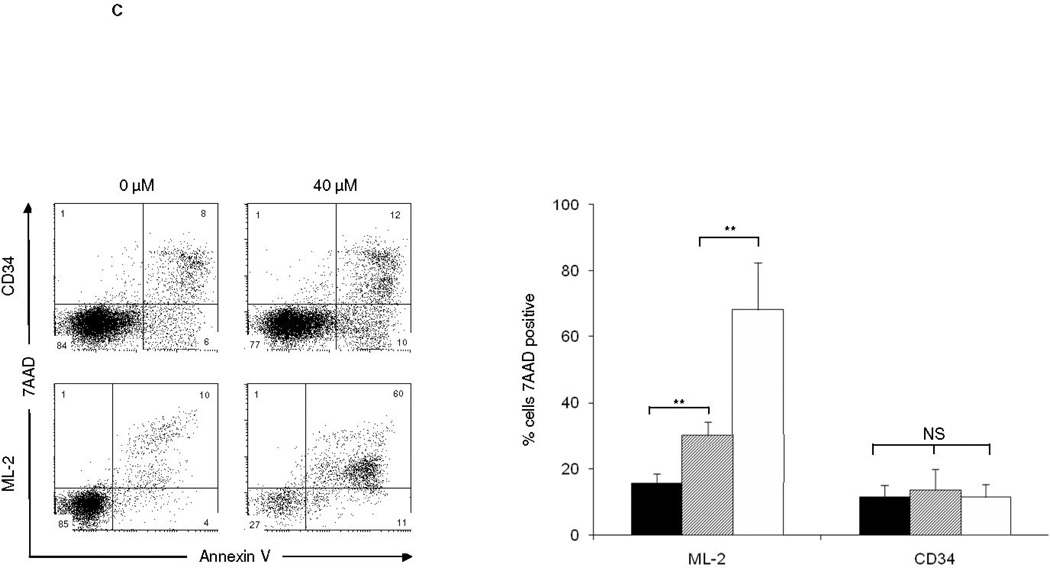
The Rac-specific inhibitor NSC23766 significantly impacts proliferation, survival, and cell cycle progression of human AML cell lines. (A) Proliferation of a panel of AML cell lines was analyzed by MTS assay 72 hrs after exposure to increasing doses of NSC23766 (n=3, 24 wells per condition). Black bars indicate 0 µM, hatched bars 20 µM, and white bars 40 µM NSC23766. (B) NSC23766 inhibits Rac activation in ML-2 cells. ML-2 cells were cultured in the presence of increasing doses of NSC23766. Lysates were analyzed for active, GTP-Rac. As controls, total lysates were analyzed for Rac and actin expression. (C) Apoptosis of ML-2 and CD34+ cells was analyzed 72 hours after exposure to NSC23766. Left panel depicts a representative dot blot analysis. Numbers indicate percentage of cells per quadrant. Graph depicts percentage of 7AAD-positive cells after exposure to 0 µM (black bars), 20 µM (hatched bars), or 40 µM (white bars) NSC23766 (n=5). (D) Cell cycle analysis of ML-2 and CD34+ cells was performed 48 hours after exposure to NSC23766. Left panel depicts representative dot blot after exposure to 0 or 40 µM NSC23766. Graph depicts percentage of cells in G1/G0 or S phase of cell cycle 48 hours after exposure to 0 µM (black bars) or 40 µM (white bars) NSC23766, respectively (n=5). ** p<0.01, NS = not significant.
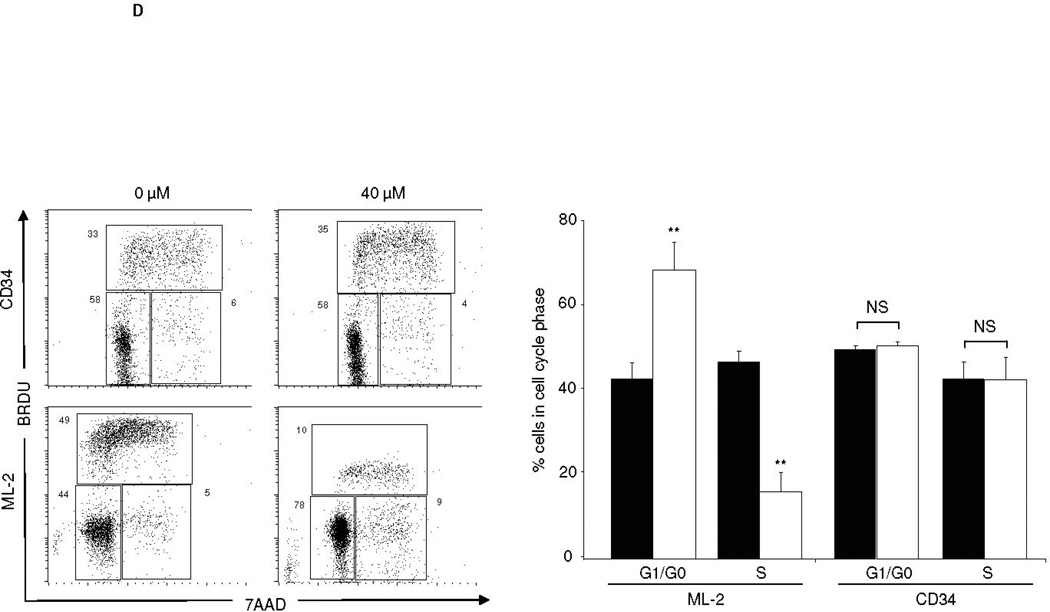
The Rac-specific inhibitor NSC23766 significantly impacts proliferation, survival, and cell cycle progression of human AML cell lines. (A) Proliferation of a panel of AML cell lines was analyzed by MTS assay 72 hrs after exposure to increasing doses of NSC23766 (n=3, 24 wells per condition). Black bars indicate 0 µM, hatched bars 20 µM, and white bars 40 µM NSC23766. (B) NSC23766 inhibits Rac activation in ML-2 cells. ML-2 cells were cultured in the presence of increasing doses of NSC23766. Lysates were analyzed for active, GTP-Rac. As controls, total lysates were analyzed for Rac and actin expression. (C) Apoptosis of ML-2 and CD34+ cells was analyzed 72 hours after exposure to NSC23766. Left panel depicts a representative dot blot analysis. Numbers indicate percentage of cells per quadrant. Graph depicts percentage of 7AAD-positive cells after exposure to 0 µM (black bars), 20 µM (hatched bars), or 40 µM (white bars) NSC23766 (n=5). (D) Cell cycle analysis of ML-2 and CD34+ cells was performed 48 hours after exposure to NSC23766. Left panel depicts representative dot blot after exposure to 0 or 40 µM NSC23766. Graph depicts percentage of cells in G1/G0 or S phase of cell cycle 48 hours after exposure to 0 µM (black bars) or 40 µM (white bars) NSC23766, respectively (n=5). ** p<0.01, NS = not significant.
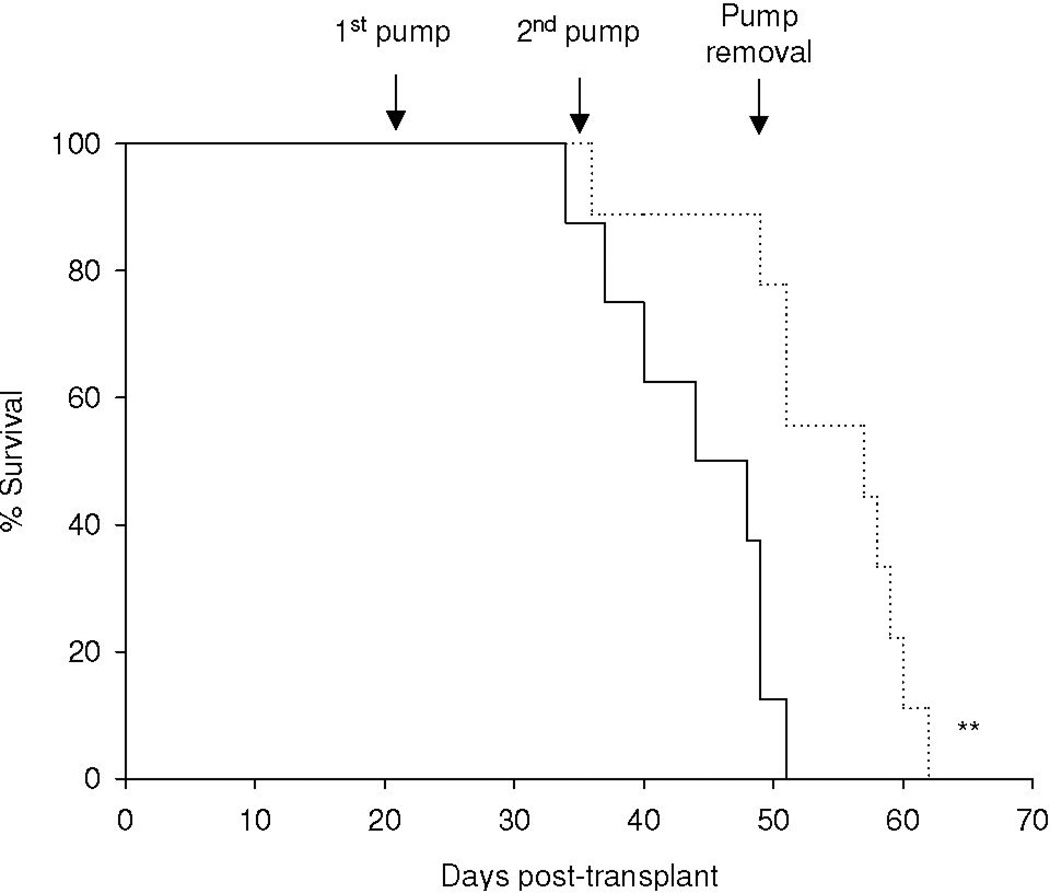
NSC23766 significantly delays the development of leukemia in a murine in vivo model. 2 × 10⁷ ML-2 cells were transplanted into sublethally irradiated NOD/SCID mice. Arrows indicate placement/removal of Alzet osmotic pumps containing PBS (solid line, n=8) or NSC23766 (dotted line, n=9). ** p < 0.01 (log-rank test).
References
-
- Gu Y, Filippi MD, Cancelas JA, Siefring JE, Williams EP, Jasti AC, et al. Hematopoietic cell regulation by Rac1 and Rac2 guanosine triphosphatases. Science. 2003;302(5644):445–449. - PubMed
-
- Thomas EK, Cancelas JA, Chae HD, Cox AD, Keller PJ, Perrotti D, et al. Rac guanosine triphosphatases represent integrating molecular therapeutic targets for BCR-ABL-induced myeloproliferative disease. Cancer Cell. 2007;12(5):467–478. - PubMed
-
- Rozenveld-Geugien M, Baas IO, van Gosliga D, Vellenga E, Schuringa JJ. Expansion of normal and leukemic human hematopoietic stem/progenitor cells requires rac-mediated interaction with stromal cells. Exp Hematol. 2007;35(5):782–792. - PubMed
Publication types
MeSH terms
Substances
Grants and funding
LinkOut - more resources
Full Text Sources
Other Literature Sources
Medical
Miscellaneous
