

Growth based morphogenesis of vertebrate limb bud
- PMID: 18668295
- PMCID: PMC2792361
- DOI: 10.1007/s11538-008-9334-1
Growth based morphogenesis of vertebrate limb bud
Abstract
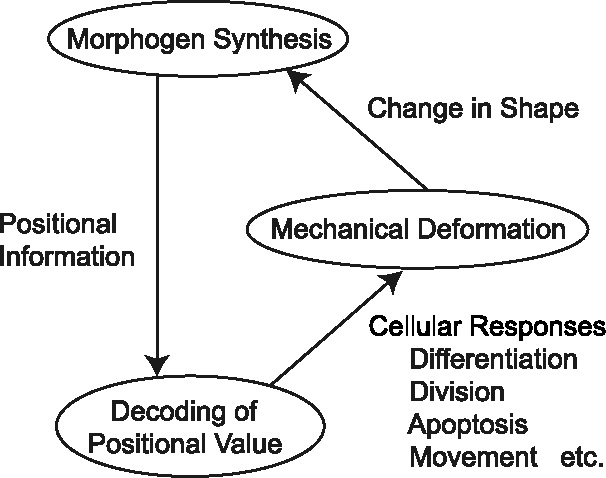
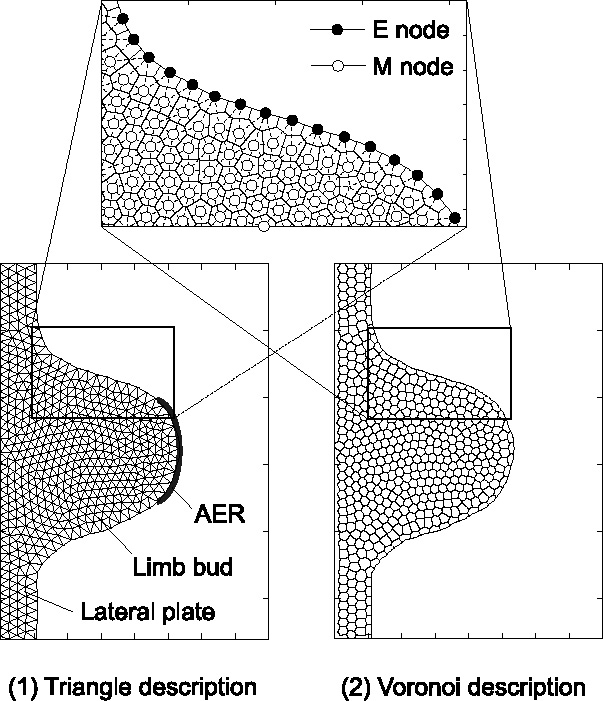
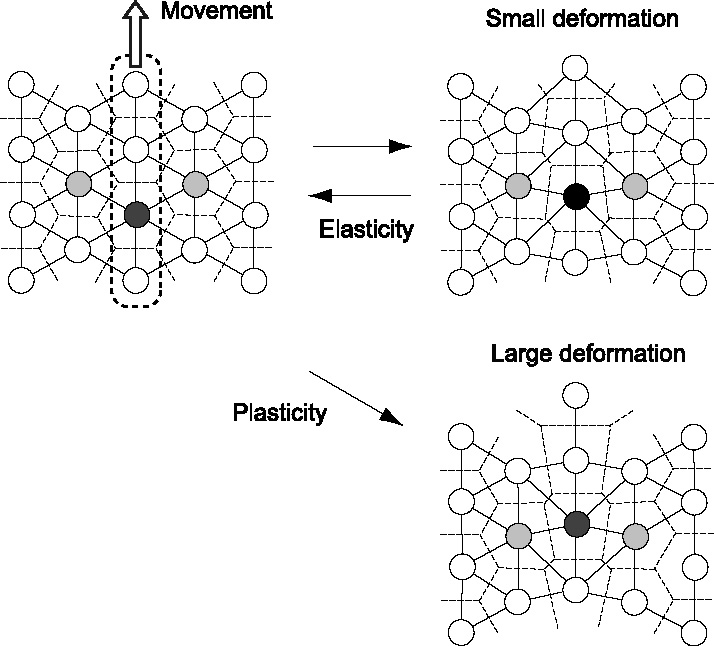
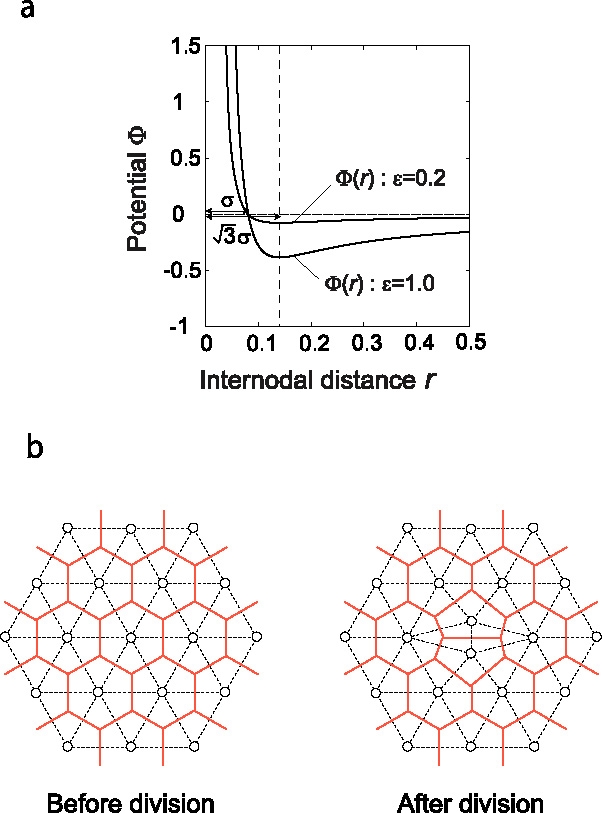
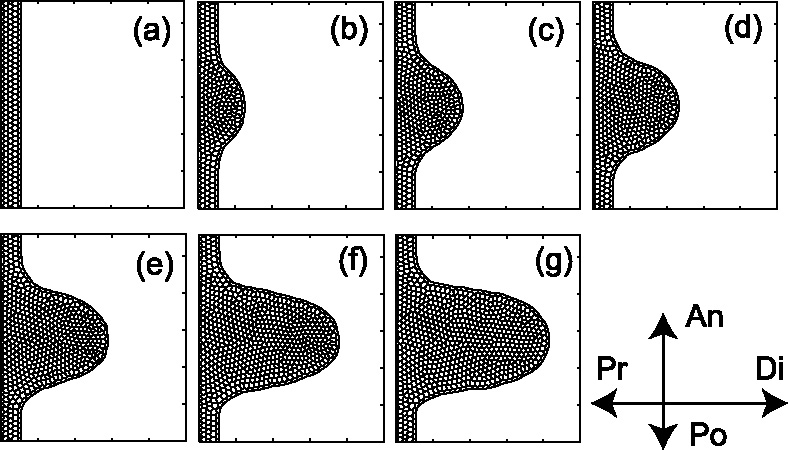
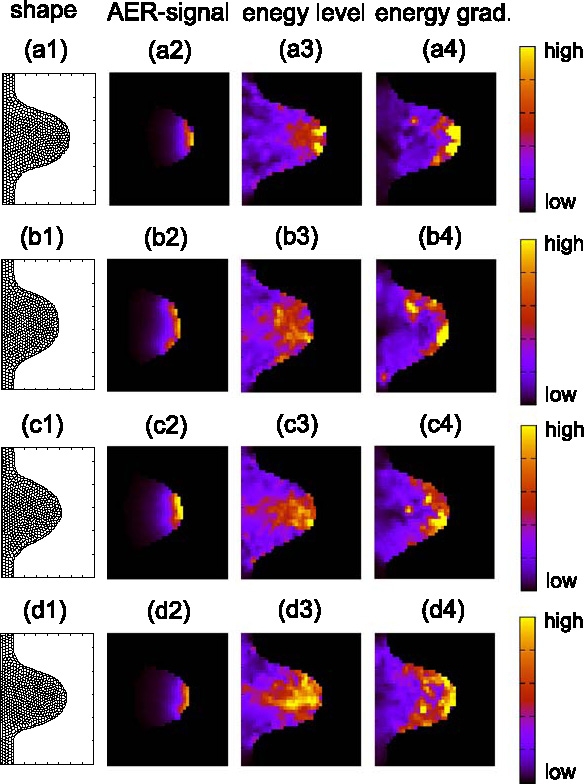
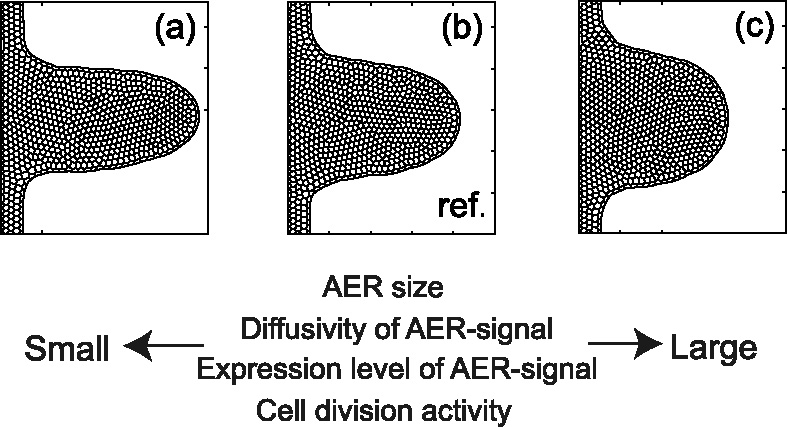
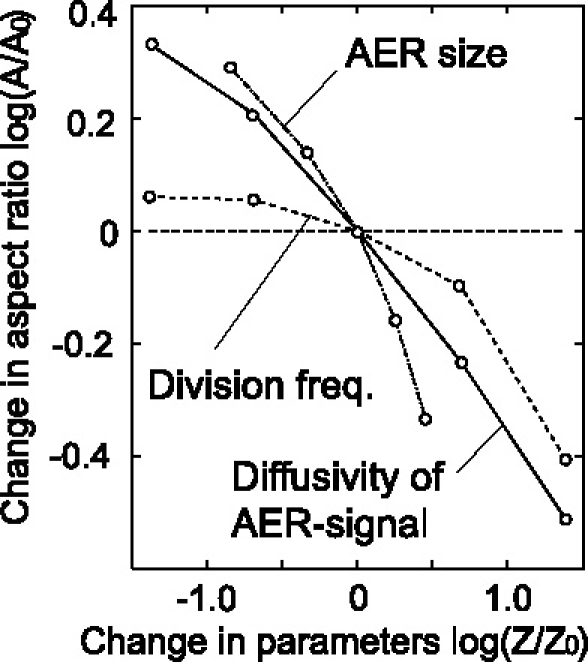
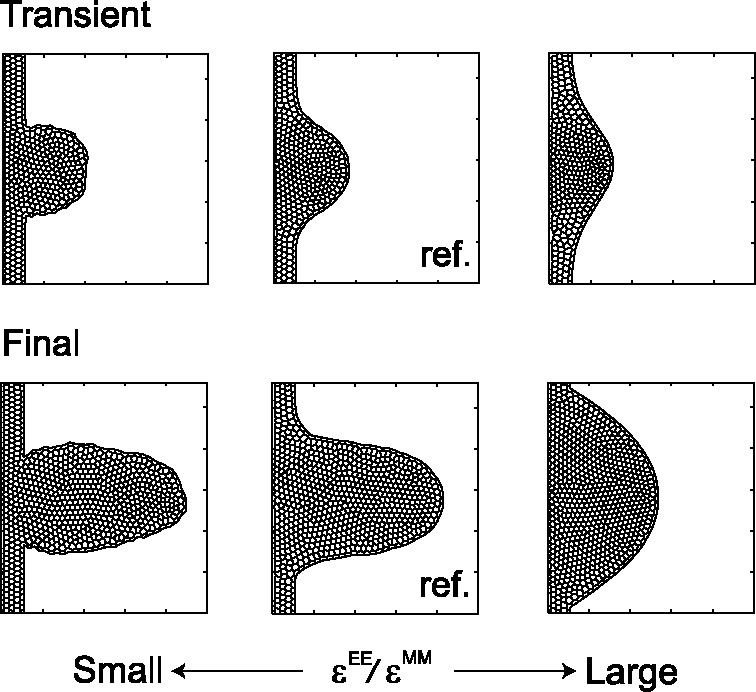
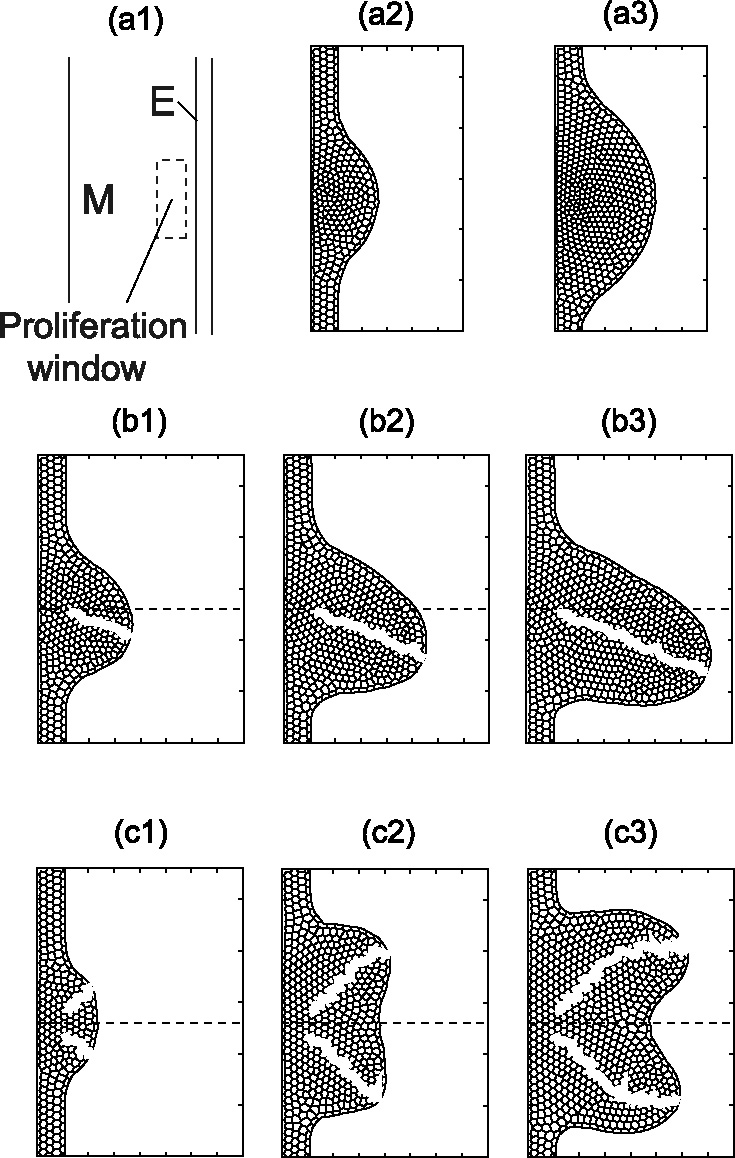
Many genes and their regulatory relationships are involved in developmental phenomena. However, by chemical information alone, we cannot fully understand changing organ morphologies through tissue growth because deformation and growth of the organ are essentially mechanical processes. Here, we develop a mathematical model to describe the change of organ morphologies through cell proliferation. Our basic idea is that the proper specification of localized volume source (e.g., cell proliferation) is able to guide organ morphogenesis, and that the specification is given by chemical gradients. We call this idea "growth-based morphogenesis." We find that this morphogenetic mechanism works if the tissue is elastic for small deformation and plastic for large deformation. To illustrate our concept, we study the development of vertebrate limb buds, in which a limb bud protrudes from a flat lateral plate and extends distally in a self-organized manner. We show how the proportion of limb bud shape depends on different parameters and also show the conditions needed for normal morphogenesis, which can explain abnormal morphology of some mutants. We believe that the ideas shown in the present paper are useful for the morphogenesis of other organs.
Figures
Similar articles
-
Biophysical regulation of early limb bud morphogenesis.Dev Biol. 2017 Sep 15;429(2):429-433. doi: 10.1016/j.ydbio.2017.06.034. Epub 2017 Jun 30. Dev Biol. 2017. PMID: 28669818 Review.
-
Budding behaviors: Growth of the limb as a model of morphogenesis.Dev Dyn. 2011 May;240(5):1054-62. doi: 10.1002/dvdy.22601. Epub 2011 Mar 7. Dev Dyn. 2011. PMID: 21384474 Review.
-
The role of spatially controlled cell proliferation in limb bud morphogenesis.PLoS Biol. 2010 Jul 13;8(7):e1000420. doi: 10.1371/journal.pbio.1000420. PLoS Biol. 2010. PMID: 20644711 Free PMC article.
-
WNT5A/JNK and FGF/MAPK pathways regulate the cellular events shaping the vertebrate limb bud.Curr Biol. 2010 Nov 23;20(22):1993-2002. doi: 10.1016/j.cub.2010.09.063. Epub 2010 Nov 4. Curr Biol. 2010. PMID: 21055947 Free PMC article.
-
How the embryo makes a limb: determination, polarity and identity.J Anat. 2015 Oct;227(4):418-30. doi: 10.1111/joa.12361. Epub 2015 Aug 7. J Anat. 2015. PMID: 26249743 Free PMC article. Review.
Cited by
-
Collective cell movement promotes synchronization of coupled genetic oscillators.Biophys J. 2014 Jul 15;107(2):514-526. doi: 10.1016/j.bpj.2014.06.011. Biophys J. 2014. PMID: 25028893 Free PMC article.
-
Bare bones pattern formation: a core regulatory network in varying geometries reproduces major features of vertebrate limb development and evolution.PLoS One. 2010 May 28;5(5):e10892. doi: 10.1371/journal.pone.0010892. PLoS One. 2010. PMID: 20531940 Free PMC article.
-
Limbs made to measure.PLoS Biol. 2010 Jul 13;8(7):e1000421. doi: 10.1371/journal.pbio.1000421. PLoS Biol. 2010. PMID: 20644713 Free PMC article. No abstract available.
-
Digit patterning during limb development as a result of the BMP-receptor interaction.Sci Rep. 2012;2:991. doi: 10.1038/srep00991. Epub 2012 Dec 18. Sci Rep. 2012. PMID: 23251777 Free PMC article.
-
Wnt/planar cell polarity signaling: an important mechanism to coordinate growth and patterning in the limb.Organogenesis. 2011 Oct-Dec;7(4):260-6. doi: 10.4161/org.7.4.19049. Organogenesis. 2011. PMID: 22198433 Free PMC article. Review.
References
-
- Alberts B., Johnson A., Lewis J., Raff M., Roberts K., Walter P. Molecular Biology of the Cell. 4. New York: Garland; 2002.
-
- Bottino D.C. Modeling viscoelastic networks and cell deformation in the context of the immersed boundary method. J. Comput. Phys. 1998;147:86–113. doi: 10.1006/jcph.1998.6074. - DOI
-
- Bottino D., Mogilner A., Roberts T., Stewart M., Oster G. How nematode sperm crawl. J. Cell. Sci. 2002;115:367–384. - PubMed
Publication types
MeSH terms
Substances
LinkOut - more resources
Full Text Sources
Miscellaneous
