. 2008 Oct 1;510(4):367-77.
doi: 10.1002/cne.21796.

Distribution of voltage-gated potassium and hyperpolarization-activated channels in sensory afferent fibers in the rat carotid body

Affiliations

Distribution of voltage-gated potassium and hyperpolarization-activated channels in sensory afferent fibers in the rat carotid body

Maria Buniel et al. J Comp Neurol. .

Abstract

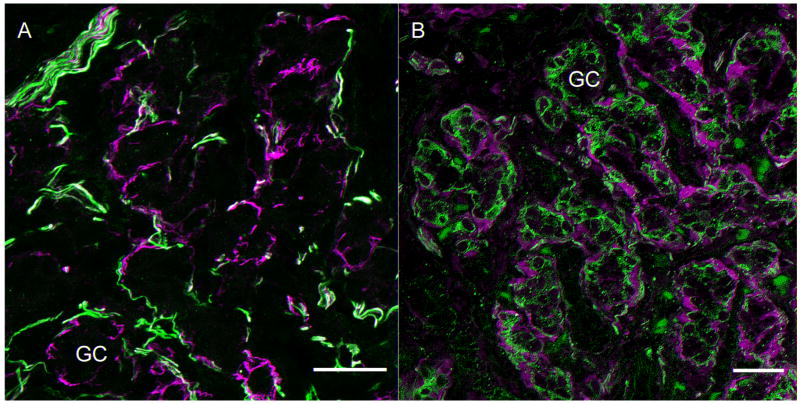
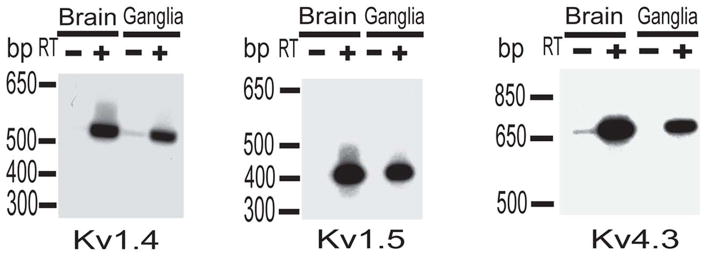
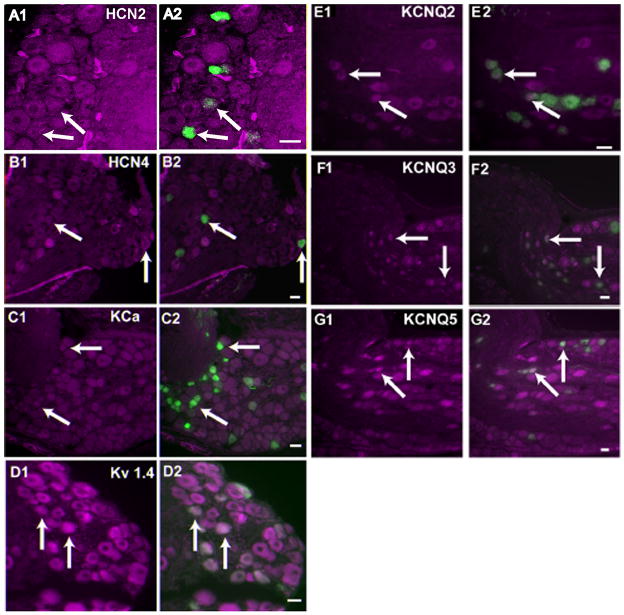
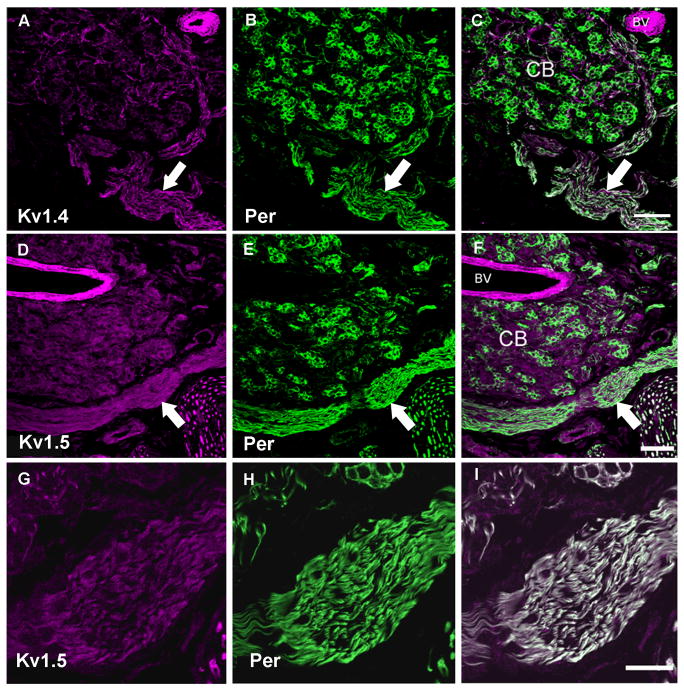
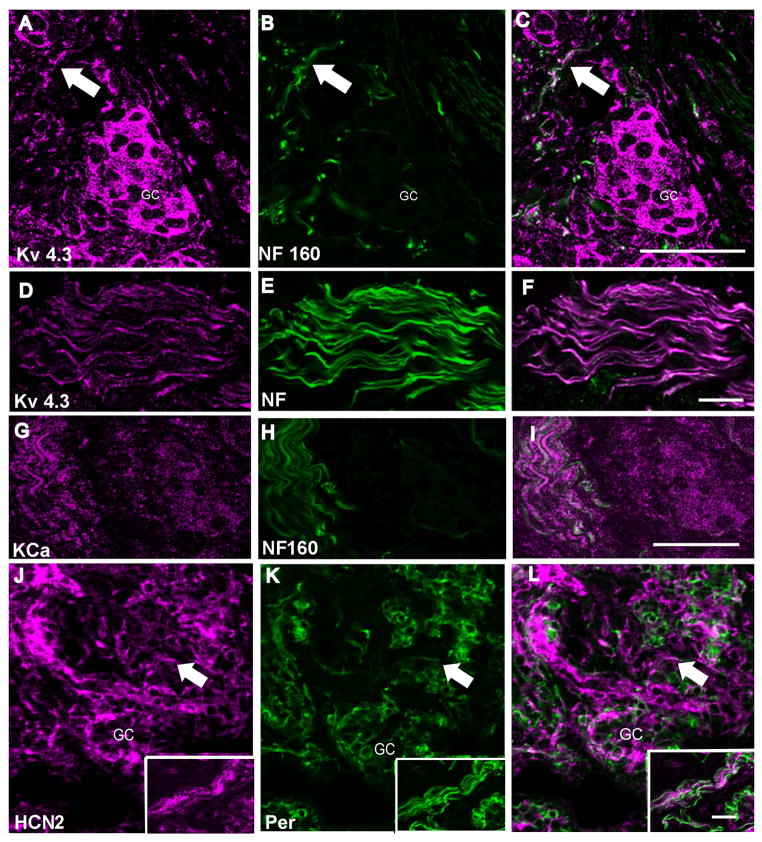
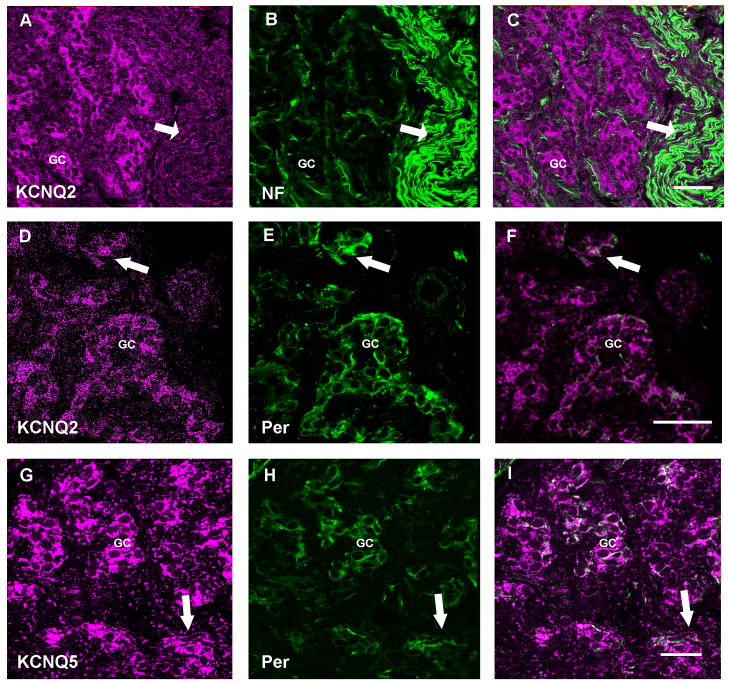
The chemosensory glomus cells of the carotid body (CB) detect changes in O2 tension. Carotid sinus nerve fibers, which originate from peripheral sensory neurons located within the petrosal ganglion, innervate the CB. Release of transmitter from glomus cells activates the sensory afferent fibers to transmit information to the nucleus of the solitary tract in the brainstem. The ion channels expressed within the sensory nerve terminals play an essential role in the ability of the terminal to initiate action potentials in response to transmitter-evoked depolarization. However, with a few exceptions, the identity of ion channels expressed in these peripheral nerve fibers is unknown. This study addresses the expression of voltage-gated channels in the sensory fibers with a focus on channels that set the resting membrane potential and regulate discharge patterns. By using immunohistochemistry and fluorescence confocal microscopy, potassium channel subunits and HCN (hyperpolarization-activated) family members were localized both in petrosal neurons that expressed tyrosine hydroxylase and in the CSN axons within the carotid body. Channels contributing to resting membrane potential, including HCN2 responsible in part for I(h) current and the KCNQ2 and KCNQ5 subunits thought to underlie the neuronal "M current," were identified in the sensory neurons and their axons innervating the carotid body. In addition, the results presented here demonstrate expression of several potassium channels that shape the action potential and the frequency of discharge, including Kv1.4, Kv1.5, Kv4.3, and K(Ca) (BK). The role of these channels should be considered in interpretation of the fiber discharge in response to perturbation of the carotid body environment.


Figures

Figure 1
Figure 1. Markers of sensory innervation of Type 1 glomus cell clusters in the carotid body
A. Neurofilament cocktail (anti-NF 200, 120 and 68) labels major fibers surrounding but seldom penetrating glomus cell clusters (green). Anti-GFAP (Accurate) labels cells that surround the glomus cell clusters (magenta) in close proximity to the nerve fibers. Scale bar= 25μm B. This panel illustrates the neural innervation stained with anti-peripherin antibody. (green). The fibers surround and infiltrate the clusters of Type I glomus cells. The Type 2 cells surround the Type 1 clusters and are immunolabeled with S100 antibody (magenta, Santa Cruz). Scale bar=20μm. GC=glomus cell cluster.
Figure 2
Figure 2. Expression of Kv1.4, Kv1.5 and Kv4.3 channel mRNAs in brain and nodose/petrosal ganglia
Oligonucleotide primers designed to specifically amplify Kv1.4, Kv1.5 and Kv4.5 channels were used in RT-PCR reactions from the rat ganglia and, for comparison, brain Poly A+ RNA. As a control, first-strand cDNA reactions were performed with (+) or (−) reverse transcriptase (RT). In both reactions, brain and ganglia, the (–)RT lanes had no signal. Expected size of the cDNA fragments was 543bp, 414bp and 690bp for Kv1.4, Kv1.5 and Kv4.3 respectively.
Figure 3
Figure 3. Co-expression of tyrosine hydroxylase with KCNQ2, KCNQ3, KCNQ5, KCa, Kv1.4, HCN2 and HCN4 in neurons of the petrosal ganglion
The left panel for each antibody demonstrates ion channel immunoreactivity psuedocolored in magenta. The right panels are the resultant overlay of TH immunoreactive neurons (green) whose afferent fibers terminate on the glomus cells. Arrows identify some of the cells exhibiting both TH and the ion channel immunoreactivity. Panel A1, A2: HCN2 (NeuroMab); Panel B1, B2: HCN4; Panel C1, C2: Kca (NeuroMab); Panel D1, D2: Kv1.4; Panel E1, E2 : KCNQ2 (NeuroMab); Panel F1,F2: KCNQ3; Panel G1, G2:KCNQ5. Scale in all the panels = 15um
Figure 4
Figure 4. Voltage-gated potassium channel immunoreactivity in fibers of carotid body sections
In all panels the left image is the ion channel immunoreactivity pseudo-colored in magenta, the center image illustrates anti-peripherin (green). The right image is a merge of the two images. Panel A–C: Low magnification image of carotid body stained with anti-Kv1.4 and anti-peripherin. The carotid sinus nerve enters from below and branches to surround the carotid body. Fine fibers containing Kv1.4 are seen to penetrate the clusters, co-localizing with peripherin within the carotid body in this confocal z-series stack. Scale = 50μm. Panel D–F: Low magnification confocal image of the carotid body and carotid sinus nerve (arrow) immunolabeled with anti-Kv1.5 and anti-peripherin. The glomus cells are also densely labeled with anti-Kv1.5. Scale represents 50 μm. Panel G–I: High magnification of z-series confocal image of the carotid sinus nerve co-localized with anti-Kv 1.5 and anti-peripherin. There is strong co-localization in the nerve as indicated by the white in the merged image. This higher magnification image shows in more detail a small group of glomus cells at the upper region of the image co-localizing Kv1.5 and peripherin with additional labeling within the glomus cells. Scale represents 20μm. CB = carotid body, BV = blood vessel.
Figure 5
Figure 5. Distribution of Kv4.3, KCa, and HCN2 immunoreactivity in the carotid body nerve fibers
In all panels the left image is the ion channel immunoreactivity pseudo-colored in magenta, the center image illustrates anti-NF, anti-NF160 or anti-peripherin (green). The right image is a merge of the two images. Panel A–C is a confocal Z-series stack demonstrating the distribution of anti-NF160 and anti-Kv4.3. The arrow illustrates one example of co-localization in fibers in the carotid body. The individual glomus cells are highly immunoreactive for Kv4.3 making it impossible to distinguish between innervating fibers and cell bodies within the cluster. Scale = 50μm. Panel D–F is a high magnification confocal z-series of the carotid sinus nerve as it enters the carotid body where there is almost total overlay of Kv4.3 and the neurofilament cocktail. Scale = 20μm. Panel G–I, a single confocal image from a z-series, demonstrates at high magnification KCa channel immunoreactivity in a group of carotid sinus nerve fibers adjacent to a glomus cell cluster. The glomus cell cluster shows very punctuate labeling in this single image. Similar results were obtained with the two antibodies listed in Table 1. Scale = 50μm. Panel J–L is a low magnification confocal slice showing the co-localization of anti-HCN2 (Alomone) and anti-peripherin (Santa Cruz). The inset shows a labeled group of CSN fibers. HCN2 immunolabeling does not appear to include the glomus cells although it co-localizes with peripherin in the fibers on the edge of the cluster and, in a few fibers, appears to penetrate the clusters. However, it is most intense in surrounding cells that do not label with anti-peripherin, probably Type II cells. Scale = 25μm. GC=glomus cell cluster.
Figure 6
Figure 6. Expression of KCNQ channel protein in carotid body fibers
In all panels the left image is the ion channel immunoreactivity pseudo-colored in magenta, the center image illustrates anti-NF or anti-peripherin (green). The right image is a merge of the two images. Panel A–C: Low magnification confocal z-series demonstrating the immunohistochemical localization of anti-KCNQ2 (Chemicon) with anti-NF. The arrow identifies the carotid sinus nerve. Scale = 40μm. Panel D–F: Single slice high magnification confocal image showing fine fibers with KCNQ2 (Chemicon) and peripherin (Santa Cruz) immunoreactivity in glomus cell clusters. Scale = 40μm. Panel G–I: anti-KCNQ5 overlays with anti-peripherin in fibers (arrow) and in glomus cell clusters in this confocal z-series stack. Scale = 25 μm. GC= Glomus cell clusters.

References

    1. Andrews EM, Kunze DL. Voltage-gated K+ channels in chemoreceptor sensory neurons of rat petrosal ganglion. Br Res. 2001;897:199–203. - PubMed
    1. Baiou D, Santha P, Avelino A, Charrua A, Bacskai T, Matesz K, Cruz F, Nagy I. Neurochemical characterization of insulin receptor-expressing primary sensory neurons in wild-type and vanilloid type 1 transient receptor potential receptor knockout mice. J Comp Neurol. 2007;503:334–347. - PubMed
    1. Bairam A, Carroll JL, Labelle Y, Khandjian EW. Differential changes in dopamine D2- and D1-receptor mRNA levels induced by hypoxia in the arterial chemoreflex pathway organs in one-day-old and adult rabbits. Biol Neo. 2003;84:222–231. - PubMed
    1. Buniel M, Schilling WP, Kunze DL. Distribution of transient receptor potential channels in the rat carotid chemosensory pathway. J Comp Neurol. 2003;464:404–413. - PubMed
    1. Chen L, Tian L, MacDonald SH, McClafferty H, Hammond MS, Huibant JM, Ruth P, Knaus HG, Shipston MJ. Functionally diverse complement of large conductance calcium- and voltage-activated potassium channel (BK) alpha-subunits generated from a single site of splicing. J Biol Chem. 2005;280:33599–60. - PubMed

Publication types

LinkOut - more resources