. 2008 Oct;18(10):1562-70.
doi: 10.1101/gr.079566.108. Epub 2008 Jul 30.

Global organization of replication time zones of the mouse genome

Affiliations

Global organization of replication time zones of the mouse genome

Shlomit Farkash-Amar et al. Genome Res. 2008 Oct.

Abstract

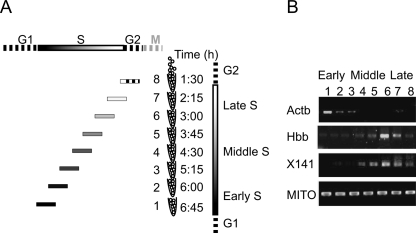
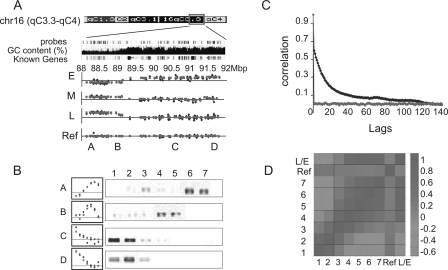
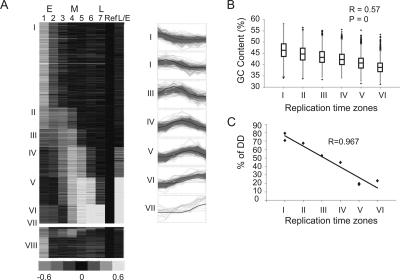
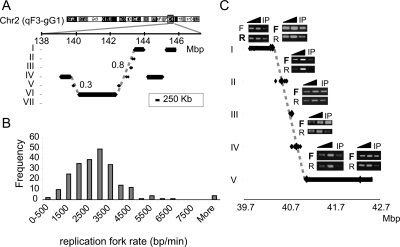
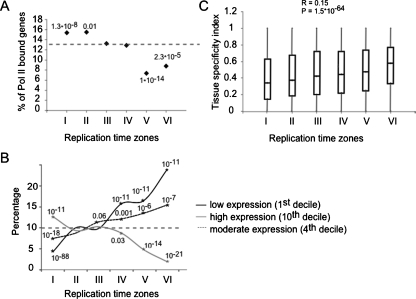
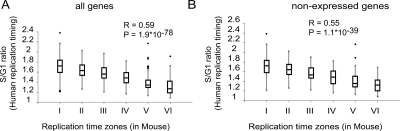
The division of genomes into distinct replication time zones has long been established. However, an in-depth understanding of their organization and their relationship to transcription is incomplete. Taking advantage of a novel synchronization method ("baby machine") and of genomic DNA microarrays, we have, for the first time, mapped replication times of the entire mouse genome at a high temporal resolution. Our data revealed that although most of the genome has a distinct time of replication either early, middle, or late S phase, a significant portion of the genome is replicated asynchronously. Analysis of the replication map revealed the genomic scale organization of the replication time zones. We found that the genomic regions between early and late replication time zones often consist of extremely large replicons. Analysis of the relationship between replication and transcription revealed that early replication is frequently correlated with the transcription potential of a gene and not necessarily with its actual transcriptional activity. These findings, along with the strong conservation found between replication timing in human and mouse genomes, emphasize the importance of replication timing in transcription regulation.


Figures

Figure 1.
Figure 1.
“Baby machine”–based cell cycle synchronization. (A) Schematic representation of the retroactive synchronization method. The cell cycle phases are represented by the bars on the top and right side of the figure. The eight samples collected by the “baby machine” are shown along with the time they were collected (the time after the end of the BrdU labeling is shown). The position and the pattern of the horizontal bars on the left of each sample, represents the portion of S that was BrdU-labeled in each sample. (B) BrdU containing DNA immunoprecipitated from each sample was subjected to semi-quantitative PCR. PCR products were detected for mouse mitochondrial DNA (MITO), demonstrating the uniform loading of newly replicated DNA (Buzina et al. 2005). On the other hand, the early replicating gene (Actb) is enriched in the early samples and the late replicating regions (Hbb and X141) in late samples.
Figure 2.
Figure 2.
Genome-wide measurements of the time of replication. (A) A large genomic region (4 Mb) of chromosome 16 is shown along with the probes of the Agilent aCGH microarray, its GC content, and the “Known Genes” track (taken from the UCSC Genome Browser). BrdU enrichment raw (blue) and processed (red; see Methods) data is shown for samples 1,3,6 and the control experiments (E, M, L, and ref, respectively). A, B, C, and D mark the regions that were validated in B. (B) BrdU enrichment, as measured by the arrays (left; red and blue as in A) and by semi-quantitative PCR (right) for regions A–D. Note strong agreement between the data from the microarray and the gene-specific validation. (C) Autocorrelation of all probes in sample 1, with their neighboring probes sorted by their chromosomal position (red) or location on the array (blue) at increasing distances (lag). Similar results were obtained for all seven samples (Supplemental Figure S1). Note that strong correlation is observed for up to at least 100 neighboring sequences (lag = 100). However, no significant autocorrelation is evident for data sorted by array location. (D) Pearson correlation was calculated between each pair of samples. L/E represents a control experiment in which sample 6 was hybridized against sample 1. Note the high correlation around the diagonal, demonstrating the positive correlation between neighboring fractions.
Figure 3.
Figure 3.
Genomic replication timing clustering and validation. (A) The seven predefined patterns (blue) and the probes assigned to each pattern (red, shown on right). A heat-map representation of the genomic data arranged according to the seven clusters (I–VII) is shown on the left. Asynchronous probes that were not assigned to any cluster (VIII) are shown at the bottom. (B) Box plot representation (the box marks the first, second and third quartiles; the whiskers mark values of ±1.5 interquartile range [IQR]; and outliers are marked by black dots) of the GC content of all regions assigned to each cluster. Cluster VII was excluded from this and subsequent analyses since it contains a small number of regions. The correlation to a regression line (R) and the P-value calculated by the F-statistics are shown. (C) FISH-based validation of replication timing. The ToR of eight regions as determined by the percentage of S-phase nuclei in which both alleles are seen as doublets (%DD) is drawn against the ToR of those probes as determined by the array. Additional FISH results are provided in Supplemental Figure S7.
Figure 4.
Figure 4.
Large replicons. (A) Large replication segments (>250 kb; black bars) and small replication segments (<250 kb; each flanked by two dots) are shown for a small region in chromosome 2. The vertical position of each line represents its assigned ToR, and the horizontal position represents its location on chromosome 2. Dashed gray lines represent the predicted replication timing of the region assuming a movement of a single replication fork from the early to the late region. The numbers next to the dashed lines represent the RMSD values between the dots and the line. Note the good agreement between the predicted replication time (dashed line) and the actual timing (black dots). Additional examples of such regions are shown in Supplemental Figure S7. (B) Histogram of the replication fork rate, as deduced from the analysis of regions containing large replicons. (C) Replication fork direction was analyzed by measuring the relative amounts of the two strands in BrdU-labeled cells and treated with emetine, which inhibits lagging strand synthesis (see Methods). The ToR of a region on chromosome 1 is shown as in A. The regions for which replication fork direction was analyzed are marked by large diamonds. For each such region, linear PCR with either a forward (F) or reverse (R) primer, followed by semi-quantitative PCR was performed (two dilutions of total DNA [triangles] and emetine-resistant BrdU-labeled DNA [IP]). The direction of the replication fork can be deduced from the relative amount of the reverse and forward reactions. Note that all five regions assayed along the diagonal line show the same direction of the fork (marked by bold letters), strongly suggesting that this entire region is replicated by a single fork.
Figure 5.
Figure 5.
Coordination between replication and transcription. (A) The percentage of genes in each replication time (I–VI) associated with RNA polymerase II (log2 ratio > 0.5) in a ChIP-chip experiment is shown along with the hypergeometric test P-values for cases enriched (clusters I and II) or depleted (clusters V and VI) over the expected average Pol II association (dashed line). (B) The percentage of genes in each replication time zone that fall into the first, fourth, and 10th expression deciles in blood cells. Significant enrichments or depletions over the expected value of 10% (dashed horizontal line) are shown (asterisks and hypergeometric P-values). Early clusters are enriched with highly expressed genes (10th decile) and depleted with low expressed genes (first decile) while late clusters show the opposite pattern. Middle clusters are enriched with genes expressed at moderate levels (fourth decile). (C) Box plot representation of the tissue specificity index distribution for each cluster. Early clusters tend to contain more house-keeping genes (index close to 0) while late clusters tend to contain more tissue-specific genes (index close to 1).
Figure 6.
Figure 6.
Conservation in replication timing between human and mouse. Box plot representation of the correspondence between human and mouse replication time for all genes (A) and for not expressed genes (B). The human replication time is shown as S:G1 ratio values (Woodfine et al. 2004), in which higher values correspond to early replication. The regression value (R) and the P-values (F-statistics) are shown.

Similar articles

Cited by

References

    1. Azuara V., Brown K.E., Williams R.R., Webb N., Dillon N., Festenstein R., Buckle V., Merkenschlager M., Fisher A.G., Brown K.E., Williams R.R., Webb N., Dillon N., Festenstein R., Buckle V., Merkenschlager M., Fisher A.G., Williams R.R., Webb N., Dillon N., Festenstein R., Buckle V., Merkenschlager M., Fisher A.G., Webb N., Dillon N., Festenstein R., Buckle V., Merkenschlager M., Fisher A.G., Dillon N., Festenstein R., Buckle V., Merkenschlager M., Fisher A.G., Festenstein R., Buckle V., Merkenschlager M., Fisher A.G., Buckle V., Merkenschlager M., Fisher A.G., Merkenschlager M., Fisher A.G., Fisher A.G. Heritable gene silencing in lymphocytes delays chromatid resolution without affecting the timing of DNA replication. Nat. Cell Biol. 2003;5:668–674. - PubMed
    1. Azuara V., Perry P., Sauer S., Spivakov M., Jorgensen H.F., John R.M., Gouti M., Casanova M., Warnes G., Merkenschlager M., Perry P., Sauer S., Spivakov M., Jorgensen H.F., John R.M., Gouti M., Casanova M., Warnes G., Merkenschlager M., Sauer S., Spivakov M., Jorgensen H.F., John R.M., Gouti M., Casanova M., Warnes G., Merkenschlager M., Spivakov M., Jorgensen H.F., John R.M., Gouti M., Casanova M., Warnes G., Merkenschlager M., Jorgensen H.F., John R.M., Gouti M., Casanova M., Warnes G., Merkenschlager M., John R.M., Gouti M., Casanova M., Warnes G., Merkenschlager M., Gouti M., Casanova M., Warnes G., Merkenschlager M., Casanova M., Warnes G., Merkenschlager M., Warnes G., Merkenschlager M., Merkenschlager M., et al. Chromatin signatures of pluripotent cell lines. Nat. Cell Biol. 2006;8:532–538. - PubMed
    1. Berezney R., Dubey D.D., Huberman J.A., Dubey D.D., Huberman J.A., Huberman J.A. Heterogeneity of eukaryotic replicons, replicon clusters, and replication foci. Chromosoma. 2000;108:471–484. - PubMed
    1. Bierne H., Michel B., Michel B. When replication forks stop. Mol. Microbiol. 1994;13:17–23. - PubMed
    1. Braunstein J.D., Schulze D., DelGiudice T., Furst A., Schildkraut C.L., Schulze D., DelGiudice T., Furst A., Schildkraut C.L., DelGiudice T., Furst A., Schildkraut C.L., Furst A., Schildkraut C.L., Schildkraut C.L. The temporal order of replication of murine immunoglobulin heavy chain constant region sequences corresponds to their linear order in the genome. Nucleic Acids Res. 1982;10:6887–6902. - PMC - PubMed

Publication types