. 2008 Aug 5;105(31):10762-7.
doi: 10.1073/pnas.0805139105. Epub 2008 Jul 31.

A quantitative atlas of mitotic phosphorylation

Affiliations

A quantitative atlas of mitotic phosphorylation

Noah Dephoure et al. Proc Natl Acad Sci U S A. .

Abstract

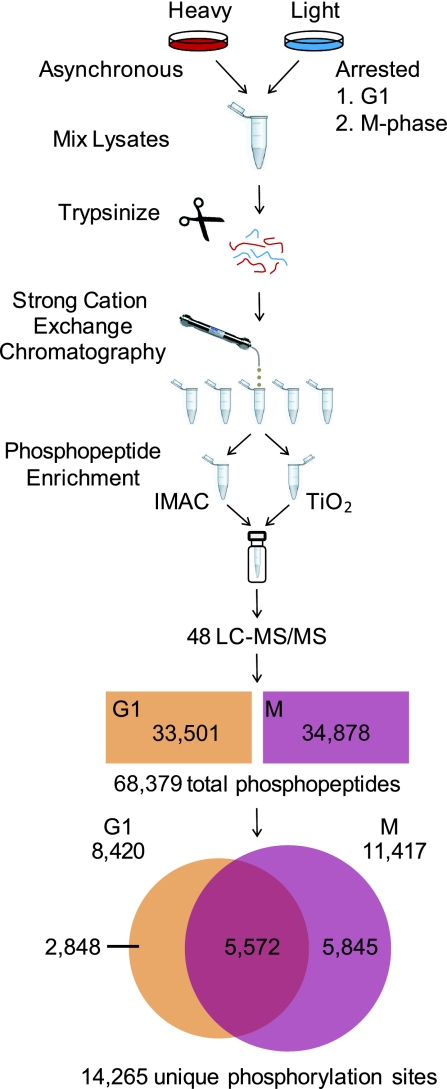
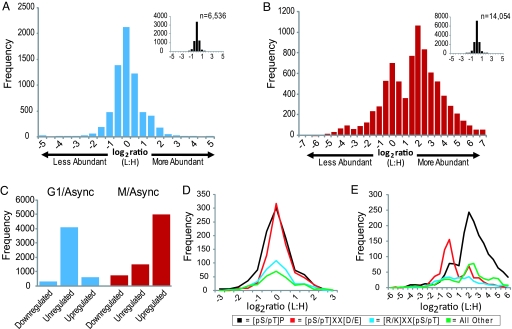
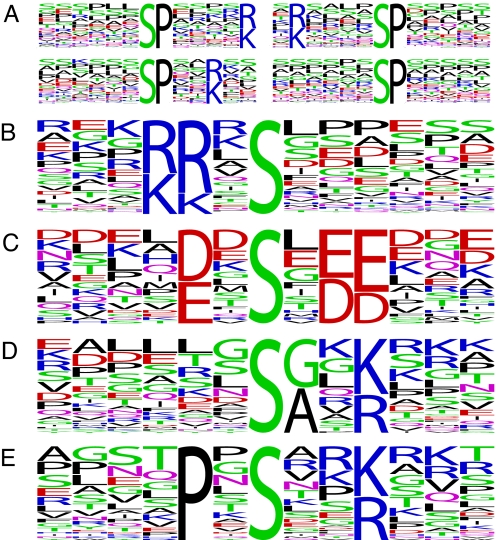
The eukaryotic cell division cycle is characterized by a sequence of orderly and highly regulated events resulting in the duplication and separation of all cellular material into two newly formed daughter cells. Protein phosphorylation by cyclin-dependent kinases (CDKs) drives this cycle. To gain further insight into how phosphorylation regulates the cell cycle, we sought to identify proteins whose phosphorylation is cell cycle regulated. Using stable isotope labeling along with a two-step strategy for phosphopeptide enrichment and high mass accuracy mass spectrometry, we examined protein phosphorylation in a human cell line arrested in the G(1) and mitotic phases of the cell cycle. We report the identification of >14,000 different phosphorylation events, more than half of which, to our knowledge, have not been described in the literature, along with relative quantitative data for the majority of these sites. We observed >1,000 proteins with increased phosphorylation in mitosis including many known cell cycle regulators. The majority of sites on regulated phosphopeptides lie in [S/T]P motifs, the minimum required sequence for CDKs, suggesting that many of the proteins may be CDK substrates. Analysis of non-proline site-containing phosphopeptides identified two unique motifs that suggest there are at least two undiscovered mitotic kinases.


Conflict of interest statement

The authors declare no conflict of interest.

Figures

Fig. 1.
Fig. 1.
Sample preparation and data analysis for quantitative cell cycle phosphoproteome profiling. Asynchronous HeLa cells were cultured in media containing 13C615N2-lysine and 13C615N4-arginine, lysed, and mixed 1:1 by cell number with lysates from double-thymidine or nocodazole arrested cells cultured in standard media and digested with trypsin in solution. Peptides from each experiment were subjected to strong-cation exchange chromatography and the eluates were collected in 12 fractions for each run. Each fraction was split and enriched for phosphopeptides with IMAC and TiO2. Enriched eluates were recombined by fraction and analyzed in duplicate on a hybrid linear ion trap–orbitrap, mass spectrometer. MS/MS spectra were searched by using SEQUEST and filtered to a 1% false-discovery rate before further automated analysis to determine phosphorylation site localization and perform quantification. The filtered dataset contained 68,379 phosphopeptides with a false discovery rate of 0.3%. These peptides contain 14,265 unique phosphorylation sites.
Fig. 2.
Fig. 2.
Phosphopeptide abundance distributions. (A and B) Log2-transformed light:heavy (arrested:asynchronous) ratios for all quantified phosphopeptides from G1 (A) and M (B) phase arrested cells. Bins are 0.5 units wide; e.g., the ‘0′ bin stretches from −0.25 to +0.25. (Insets) Shown is the distribution of unphosphorylated peptides in each experiment. (C) Peptides with ≥2.5-fold changes were deemed regulated and those with ≤1.5-fold changes unregulated. (D and E) Log2 phosphopeptide abundance distributions for peptides with different phosphorylation motifs are shown for G1 phase cells (D) and for mitotic cells (E). Phosphorylation sites were classified into 1 of 3 motifs, [pS/pT]-P, [pS/pT]-X-X-[D/E], or [K/R]-X-X-[pS/pT]. Sites lacking these motifs were grouped into “other.” Only peptides containing a single motif class were included in the analysis.
Fig. 3.
Fig. 3.
Substrate motif discovery. We extracted phospho-serine motifs from mitotically regulated peptides using Motif-X (9). Only sites with Ascore ≥ 13 and median abundance ratio (L:H) ≥ 4 (n = 2,949) were included. (A) More than half of these sites, 1,670, lie in pS-P motifs. (B and C) We identified two motifs similar to those for the mitotic kinases (B) Aurora kinase A and (C) Polo-like kinase 1, whose consensus substrate sequences are [K/N/R]-R-X-[pS/pT]-Φ and [D/E]-X-[pS/pT]-Φ-X-[D/E], respectively, where Φ denotes any hydrophobic residue. Note the bias for leucine in the +1 position for both. (D and E) We also found two notable motifs that included a basic residue at +3 but that lacked the +1 proline.
Fig. 4.
Fig. 4.
Protein regulated phosphorylation (P-RePh) scores. The P-RePh score is a cumulative assessment of regulated phosphorylation sites assigned to each protein in the dataset. (A) The fraction of M-phase P-RePh scores above a given threshold was plotted for all G1 (black trace) and M-phase (red trace) phosphoproteins along with those for proteins annotated to GO:0000278 (mitotic cell cycle) (green trace) and known mitotic phosphoproteins identified from the literature (blue trace). (B and C) Entire proteome topographical plots of up-regulated phosphorylation in G1 (B) and M-phase (C) cells. Each protein in the human proteome is represented as a single point on a continuous 138 × 138 plane. P-RePh scores are represented on the z axis. Plots are on the same scale with a maximum P-RePh of 500. The clipped peak in the mitotic plot corresponds to Ki-67 (P-RePh = 1,103).
Fig. 5.
Fig. 5.
Mitotic phosphorylation and the human protein interaction network. Shown is the first-neighbor human protein interaction network (41) for Polo-like kinase 1. Yellow nodes were found phosphorylated in our mitotic dataset. The size of each node corresponds to its mitotic P-RePh score, larger nodes are more heavily phosphorylated in mitosis. Nodes with a heavy black border also contain regulated candidate Plk1 sites. Additional networks for Cdc2, AurkA, and AurkB appear in Fig. S4.

References

    1. Morgan DO. Cyclin-dependent kinases: Engines, clocks, and microprocessors. Annu Rev Cell Dev Biol. 1997;13:261–291. - PubMed
    1. Massague J. G1 cell cycle control and cancer. Nature. 2004;432:298–306. - PubMed
    1. Rao PN, Johnson RT. Mammalian cell fusion: Studies on the regulation of DNA synthesis and mitosis. Nature. 1970;225:159–164. - PubMed
    1. Masui Y, Markert CL. Cytoplasmic control of nuclear behavior during meiotic maturation of frog oocytes. J Exp Zool. 1971;177:129–145. - PubMed
    1. Lohka MJ, Hayes MK, Maller JL. Purification of maturation-promoting factor, an intracellular regulator of early mitotic events. Proc Natl Acad Sci USA. 1988;85:3009–3013. - PMC - PubMed

Publication types