. 2008 Aug 5;105(31):10907-12.
doi: 10.1073/pnas.0802437105. Epub 2008 Jul 31.

GATA transcription factors directly regulate the Parkinson's disease-linked gene alpha-synuclein

Affiliations

GATA transcription factors directly regulate the Parkinson's disease-linked gene alpha-synuclein

Clemens R Scherzer et al. Proc Natl Acad Sci U S A. .

Abstract

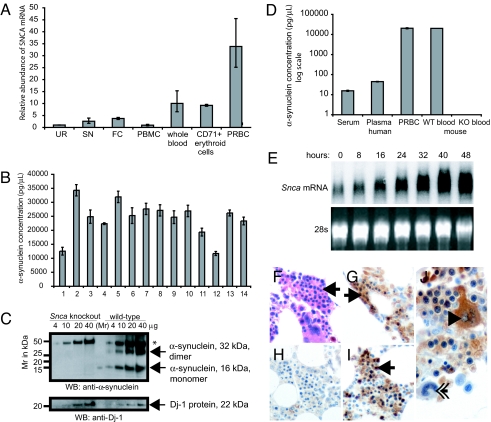
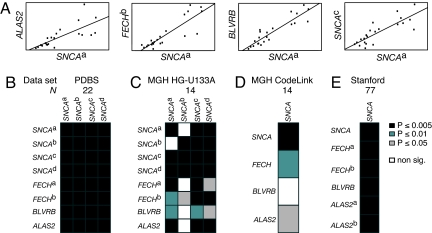
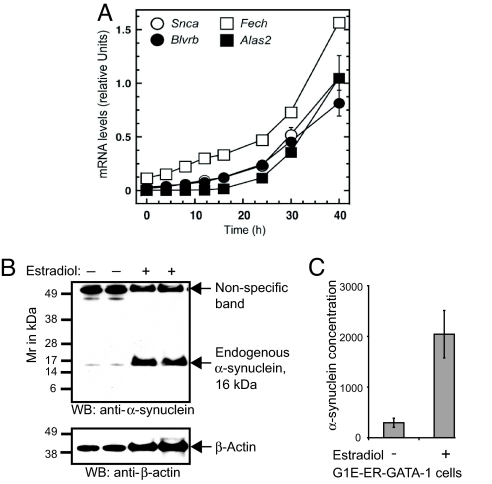
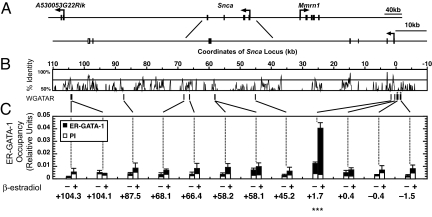
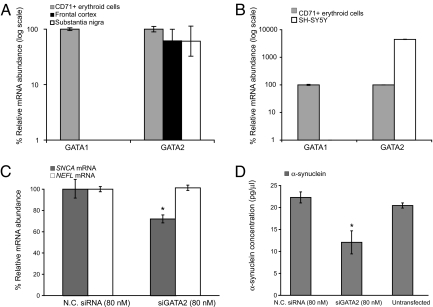
Increased alpha-synuclein gene (SNCA) dosage due to locus multiplication causes autosomal dominant Parkinson's disease (PD). Variation in SNCA expression may be critical in common, genetically complex PD but the underlying regulatory mechanism is unknown. We show that SNCA and the heme metabolism genes ALAS2, FECH, and BLVRB form a block of tightly correlated gene expression in 113 samples of human blood, where SNCA naturally abounds (validated P = 1.6 x 10(-11), 1.8 x 10(-10), and 6.6 x 10(-5)). Genetic complementation analysis revealed that these four genes are co-induced by the transcription factor GATA-1. GATA-1 specifically occupies a conserved region within SNCA intron-1 and directly induces a 6.9-fold increase in alpha-synuclein. Endogenous GATA-2 is highly expressed in substantia nigra vulnerable to PD, occupies intron-1, and modulates SNCA expression in dopaminergic cells. This critical link between GATA factors and SNCA may enable therapies designed to lower alpha-synuclein production.


Conflict of interest statement

Conflict of interest statement: C.R.S., E.H.B., and M.G.S. are listed as coinventors on a United States patent application related to the development of therapeutics for Parkinson's disease.

Figures

Fig. 1.
Fig. 1.
SNCA mRNA and protein is abundantly expressed in human and mouse erythroid cells. (A) SNCA mRNA was quantified by quantitative PCR using the ribosomal gene RPL13 as reference and Human Universal Reference RNA (UR) as calibrator. Relative SNCA mRNA abundance was high in whole blood of human donors without neurologic disease (relative abundance 10 {range 6.6–15.3}) and in immunopurified CD71+ erythroid cells (9.2 {8.8–9.6}), and also very high in packed red blood cells (PRBC) (33.8 {25.2–45.5}) after removal of plasma and buffy coat containing white blood cells and platelets. Relative SNCA mRNA abundance in peripheral blood mononuclear white cells (PBMC) (0.9 {0.7–1.3}), as well as in two brain regions vulnerable to PD pathology, human frontal cortex (FC) and substantia nigra (SN), was low (3.7 {3.3–4.1} and 2.6 {1.7–3.9}, respectively). (B–D) Detailed characterization of α-synuclein protein abundance revealed high levels in cell lysates of whole blood from 14 healthy humans by sandwich ELISA (B) and mice by Western blot analysis (C). (C) Wild-type, full-length murine α-synuclein was found in lysates of whole blood of wild-type mice (right) in the form of monomers (16 kDa) and dimers (32 kDa) and was absent in Snca knockout mice (left). Western blot analysis with anti-Dj-1 antibodies is shown as loading control. *, abundant, nonspecific, ≈50-kDa band due to cross-reactivity of the secondary anti-mouse antibody with mouse antigen. (D) α-Synuclein was particularly abundant in the cellular blood compartments, PRBC, and whole blood by sandwich ELISA (16). α-Synuclein concentrations measured 15.0 ± 0.9 pg/μl in fresh serum, 45.0 ± 1.4 pg/μl in fresh plasma, and 24.16 ± 1.7 ng/μl in whole blood lysates and PRBC. (E) SNCA mRNA was strongly and progressively expressed in a model system of terminal erythroid differentiation by Northern blot analysis. Transformed erythroblasts were harvested after 0, 8, 16, 24, 32, 40, and 48 h. (F–J) Erythroblasts (arrows) in human bone marrow smears (F) (H&E stain) show strong α-synuclein-immunoreactivity with monoclonal antibody Syn-1 (G) and rabbit-based, affinity-purified hSA-2 (I). (H) In the absence of primary antibody, no α-synuclein-immunoreactivity is detected. (J) α-Synuclein-immunoreactivity is also detected in megakaryocytes by Syn-1 (arrowhead) but not in myeloid cells (double arrow).
Fig. 2.
Fig. 2.
Expression of SNCA and heme metabolism genes ALAS2, FECH, and BLVRB is tightly and significantly correlated in human blood in four datasets. (A) Scatterplots of SNCAa and ALAS2, FECHb, and BLVRB expression are shown, respectively. SNCA expression measured by two distinct SNCA probes is plotted for comparison (rightmost plot). (B–E) Heatmaps visualize the P-value of the pairwise Spearman rank correlation between expression of SNCA (columns) and expression of SNCA, ALAS2, FECH, and BLVRB (rows) in four datasets. Correlations are shown as black (P ≤ 0.005), dark gray (P ≤ 0.01), or light gray cells (P ≤ 0.05). Nonsignificant correlations are represented as white cells. Probe-level correlations are shown for four distinct SNCA probes in B and C and two FECH probes in B, C, and E. (B) P-values of the correlations of SNCA and ALAS2, FECH, and BLVRB expression in the discovery set. These remain significant after Bonferroni correction. (C–E) Coexpression of SNCA with BLVRB was robustly replicated in two and coexpression of SNCA with ALAS2 and FECH in three validation studies comprising two independent populations of 14 and 77 control individuals and three different array platforms (C, Affymetrix; D, CodeLink; E, cDNA array). Correlations with P ≤ 0.05 (black and gray cells) are significant in the validation sets. Probe SNCAb is inefficient. See the main text and SI Methods for details.
Fig. 3.
Fig. 3.
The hematopoietic transcription factor GATA-1 activates Snca transcription in GIE-ER-GATA-1 cells. (A) Expression of murine Snca and the heme metabolism genes Alas2, Fech, and BlvrB are co-induced by conditionally active GATA-1 (ER-GATA-1). Relative levels of Snca, Alas2, Fech, and BlvrB mRNA are quantified by real-time PCR at 2–40 h postinduction of ER-GATA-1. The mRNA levels are normalized by Gapdh mRNA and expressed as relative expression. (B) ER-GATA-1 activation in G1E-ER-GATA-1 cells induces endogenous α-synuclein protein, as detected by Western blot analysis (Upper). (Lower) Western blot with anti-actin after stripping and reprobing. (C) α-Synuclein concentration (pg/μl) is increased 6.9-fold in lysates of estradiol-induced compared with uninduced G1E-ER-GATA-1 cells when quantified by sandwich ELISA (hSA-2/Syn1-B).
Fig. 4.
Fig. 4.
GATA-1 occupies a highly restricted region within intron-1 of Snca. (A) The organization of the murine Snca locus with respect to neighboring genes on chromosome 6 is shown at the top. (B) VISTA plot (49) of a ≈100-kb region of the Snca locus showing percentage identity of the human and mouse sequences. Ten GATA motifs in the Snca locus are evolutionary conserved between mice and humans (WGATAR, indicated by vertical lines). Coordinates are based on the predicted Snca transcription start site, which was designated as 1. Although the mouse 2.0-kb Snca promoter region does not contain conserved GATA sites, it contains three and four nonconserved GATA motifs at −0.4 and −1.5 kb of the mouse Snca promoter region, respectively (indicated by vertical lines with *). (C) Analysis of the 10 conserved and the two nonconserved GATA motifs by ChlP revealed that ER-GATA-1 occupied a single, highly restricted region within intron-1 of Snca (indicted by ***). The bar graphs depict relative ER-GATA-1 occupancy in G1E-ER-GATA-1 cells at each of the 12 sites (mean ± standard error, at least three independent experiments) in untreated and 1 μM β-estradiol-treated (24 h) G1E-ER-GATA-1 cells measured by ChIP analysis. No GATA-1 occupancy was detected at the other nine conserved and the two nonconserved sites. Preimmune serum (PI) was used as a control.
Fig. 5.
Fig. 5.
Silencing of endogenous neuronal GATA-2 represses the expression of SNCA mRNA and α-synuclein protein in dopaminergic cells. (A) GATA2 mRNA is highly expressed in postmortem substantia nigra and superior frontal cortex (total n = 9; 61% and 62%, respectively, of its abundance in the calibrator CD71+ erythroblasts). (B) In dopaminergic SH-SY5Y neuroblastoma cells, GATA2 mRNA abundance was exceedingly high (4,500% of the abundance in the calibrator). GATA-1 was highly expressed in erythroid cells but undetectable in human brain and neuroblastoma cells (A and B). Note the log scales. (C and D) Silencing of neuronal GATA-2 induced a decrease in neuronal expression of both SNCA mRNA and α-synuclein protein. (C) Silencing of neuronal GATA-2 induced a 28% reduction in relative SNCA mRNA abundance compared with cells transfected with negative control siRNA (P = 0.008). Transcript levels of the neuronal control gene neurofilament light polypeptide 68 kDa (NEFL) were unaltered. (D) Silencing of neuronal GATA-2 induced a 46% reduction in α-synuclein protein concentration compared with cells transfected with negative control siRNA by ELISA (P = 0.01; mean and standard deviation of three independent experiments).

References

    1. Singleton AB, et al. α-Synuclein locus triplication causes Parkinson's disease. Science. 2003;302:841. - PubMed
    1. Maraganore DM, et al. Collaborative analysis of α-synuclein gene promoter variability and Parkinson disease. J Am Med Assoc. 2006;296:661–670. - PubMed
    1. Farrer M, et al. Comparison of kindreds with parkinsonism and α-synuclein genomic multiplications. Ann Neurol. 2004;55:174–179. - PubMed
    1. Scherzer CR, Feany MB. Yeast genetics targets lipids in Parkinson's disease. Trends Genet. 2004;20:273–277. - PubMed
    1. Klein C, Schlossmacher MG. The genetics of Parkinson disease: Implications for neurological care. Nat Clin Pract Neurol. 2006;2:136–146. - PubMed

Publication types