Comparative Study
. 2008 Aug 5;105(31):10809-14.
doi: 10.1073/pnas.0804829105. Epub 2008 Jul 31.

Using noise to probe and characterize gene circuits

Affiliations
Comparative Study

Using noise to probe and characterize gene circuits

Chris D Cox et al. Proc Natl Acad Sci U S A. .

Abstract

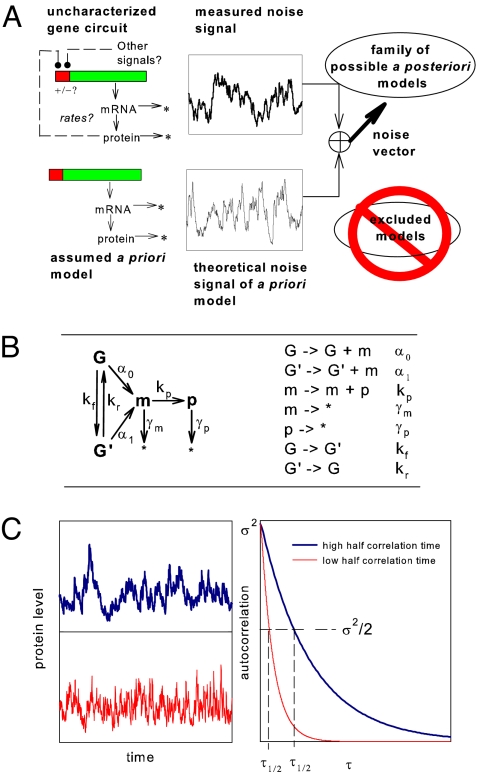
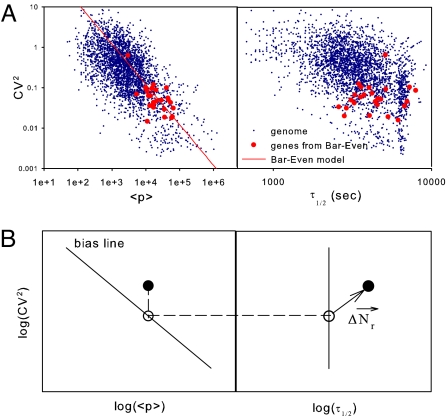
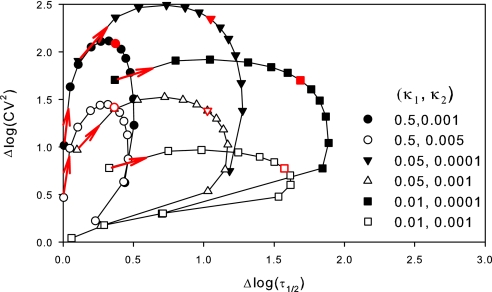
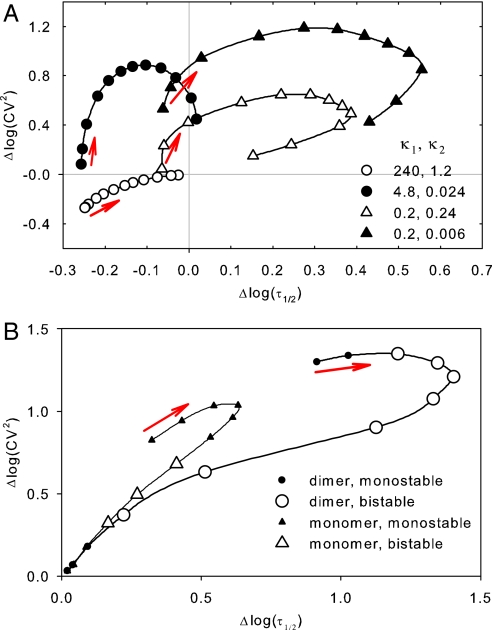
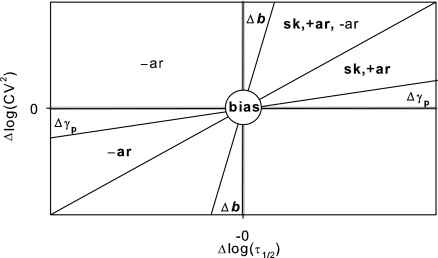
Stochastic fluctuations (or "noise") in the single-cell populations of molecular species are shaped by the structure and biokinetic rates of the underlying gene circuit. The structure of the noise is summarized by its autocorrelation function. In this article, we introduce the noise regulatory vector as a generalized framework for making inferences concerning the structure and biokinetic rates of a gene circuit from its noise autocorrelation function. Although most previous studies have focused primarily on the magnitude component of the noise (given by the zero-lag autocorrelation function), our approach also considers the correlation component, which encodes additional information concerning the circuit. Theoretical analyses and simulations of various gene circuits show that the noise regulatory vector is characteristic of the composition of the circuit. Although a particular noise regulatory vector does not map uniquely to a single underlying circuit, it does suggest possible candidate circuits, while excluding others, thereby demonstrating the probative value of noise in gene circuit analysis.


Conflict of interest statement

The authors declare no conflict of interest.

Figures

Fig. 1.
Fig. 1.
Noise regulatory vector and its application in the analysis of gene circuits. (A) The noise regulatory vector for an uncharacterized gene circuit is determined by comparison of its experimental noise structure to the noise structure of an assumed model. The vector points toward a family of gene circuits that includes the true gene circuit, and away from inappropriate models. (B) The assumed structure of the a priori model is a constitutive transcription-translation circuit. (C) Time series and autocorrelation functions for two stochastic protein populations characterized by identical 〈p〉 and CV2 but different half correlation times τ1/2.
Fig. 2.
Fig. 2.
Relationship of 3D noise map and noise regulatory vectors, ΔN⃗r. (A) Noise map for 2,920 ORFs in S. cerevisiae. A subset of 25 proteins that were both included in the Bar-Even et al. (2) study and present in our compiled database (shown in red) are observed to scatter about the Bar-Even (2) noise model CV2 = 1,200/〈(p〉 (red line), suggesting a similarity in measured noise trends [Bar-Even (2)] and those inferred from literature data (blue points). (B) Graphical definition of the bias line and ΔN⃗r. The bias line represents the behavior of the a priori model. To determine N⃗Δr for a protein with measured coordinates on the noise map (filled circle), one first locates the bias point (open circle) by projecting vertically to the bias line. ΔN⃗r is defined by the 2D vector connecting the bias point to the measured point in the log(CV2)−log(τ1/2) plane.
Fig. 3.
Fig. 3.
Noise regulatory vectors for the gene circuit in Fig. 1B as affected by slow operator kinetics. Points indicate ΔN⃗rT for G(t) values of (starting from and moving in the direction of the red arrow) 0.01, 0.05, 0.1, 0.2, 0.3, 0.4, 0.5 (red), 0.6, 0.7. 0.8, 0.9, 0.95, and 0.99. The effect of operator kinetics is captured in the ratios κ1 = krp and κ2 = kr0.
Fig. 4.
Fig. 4.
Noise regulatory vectors for autoregulation. Points indicate ΔN⃗rT at gene activation levels of (starting from and moving in the direction of the red arrow) 0.02, 0.05, 0.1, 0.2, 0.3, 0.4, 0.5, 0.6, 0.7. 0.8, 0.9, and 0.95. (A) Negative autoregulation. The effect of decreasing κ2 is to increase Δlog(τ1/2) when κ1 1 and to increase both Δlog(CV2) and Δlog(τ1/2) when κ1 < 1. (B) Positive autoregulation. The effect of multimerization and regimes of mono- and bistability.
Fig. 5.
Fig. 5.
Summary of noise vector domains for various regulatory motifs. (−ar, negative autoregulation; +ar, positive autoregulation; sk, slow gene activation kinetics). Bold font denotes domains of primary influence.

References

    1. Austin DW, et al. Gene network shaping of inherent noise spectra. Nature. 2006;439:608–611. - PubMed
    1. Bar-Even A, et al. Noise in protein expression scales with natural protein abundance. Nat Genet. 2006;38:636–643. - PubMed
    1. Blake WJ, Kaern M, Cantor CR, Collins JJ. Noise in eukaryotic gene expression. Nature. 2003;422:633–637. - PubMed
    1. Cox CD, et al. Frequency domain analysis of noise in simple gene circuits. Chaos. 2006:16. - PubMed
    1. Elowitz MB, Levine AJ, Siggia ED, Swain PS. Stochastic gene expression in a single cell. Science. 2002;297:1183–1186. - PubMed

Publication types

LinkOut - more resources