
Pyogenic bacterial infections in humans with MyD88 deficiency

Horst von Bernuth et al. Science. .

Abstract

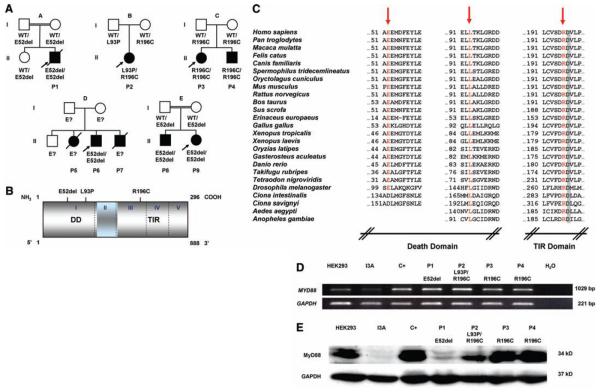
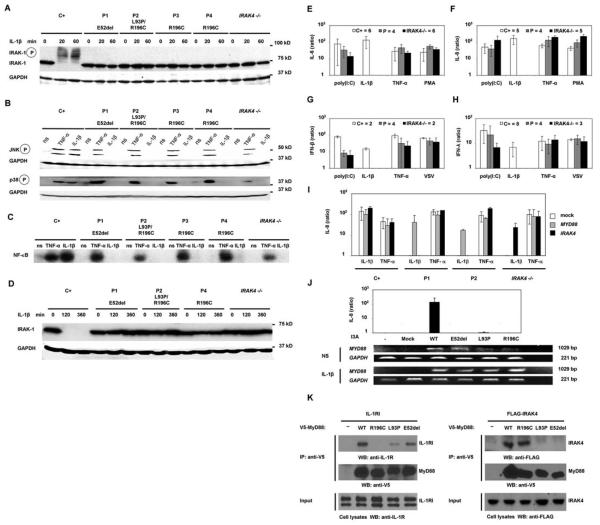
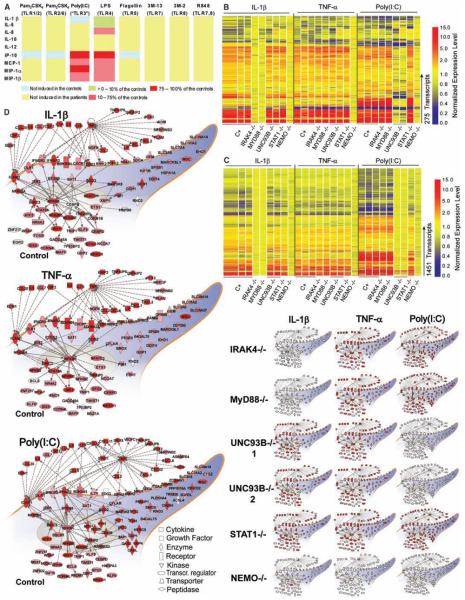
MyD88 is a key downstream adapter for most Toll-like receptors (TLRs) and interleukin-1 receptors (IL-1Rs). MyD88 deficiency in mice leads to susceptibility to a broad range of pathogens in experimental settings of infection. We describe a distinct situation in a natural setting of human infection. Nine children with autosomal recessive MyD88 deficiency suffered from life-threatening, often recurrent pyogenic bacterial infections, including invasive pneumococcal disease. However, these patients were otherwise healthy, with normal resistance to other microbes. Their clinical status improved with age, but not due to any cellular leakiness in MyD88 deficiency. The MyD88-dependent TLRs and IL-1Rs are therefore essential for protective immunity to a small number of pyogenic bacteria, but redundant for host defense to most natural infections.


Figures

Fig. 1
Fig. 1
(A) Kindreds and patients with MYD88 mutations. (B) Positions of the MyD88 mutations in the death domain (DD) or the TIR domain of the protein. (C) Parts of the DD and TIR domain of MyD88 in humans and the corresponding regions in 24 other species. The residues mutated are indicated in red. Amino acid D197 (gray) is conserved in all species. (D) Full-length MYD88 transcripts in SV40-transformed fibroblasts from a healthy control donor (C+), four MyD88-deficient patients (P1 to P4), the MyD88-deficient HEK293 cell line (I3A), and the parental MyD88-positive HEK293 cell line. (E) MyD88 protein expression in SV40-transformed fibroblasts from a healthy control (C+), four patients (P1 to P4), the I3A line, and the parental HEK293 cell line. The MyD88-specific antibody recognizes residues 279 to 296. Abbreviations for the amino acid residues are as follows: A, Ala; C, Cys; D, Asp; E, Glu; F, Phe; G, Gly; H, His; I, Ile; K, Lys; L, Leu; M, Met; N, Asn; P, Pro; Q, Gln; R, Arg; S, Ser; T, Thr; V, Val; W, Trp; and Y, Tyr.
Fig. 2
Fig. 2
(A) IRAK-1 phosphorylation and degradation upon activation by IL-1β in SV40-transformed fibroblasts from a healthy control (C+), MyD88-deficient patients (P1 to P4), and an IRAK-4–deficient patient (IRAK4 −/−). (B) Phosphorylation of MAP kinases and (C) electrophoretic mobility shift assay for NF-κB upon 20 min of activation by TNF-α and IL-1β of SV40-fibroblasts from a healthy control (C+), MyD88-deficient patients (P1 to P4), and an IRAK-4–deficient patient (IRAK4 −/−). (D) IRAK-1 degradation upon activation by IL-1β in SV40-transformed fibroblasts between 2 and 6 hours after stimulation. (E) IL-6 production, (F) IL-8 production, (G)IFN-β production, and (H) IFN-λ production by SV40-transformed fibroblasts upon 18 hours of activation by poly(I:C), IL-1β, TNF-α, and phorbol 12-myristate 13-acetate (PMA)/ionomycin (E and F) or poly(I:C), IL-1β, TNF-α, and vesicular stomatitis virus (VSV) (G and H). Results for healthy controls (C+) are shown in white, for MyD88-deficient patients (P1 to P4) in gray, and for IRAK-4–deficient patients (IRAK4 −/−) in black (numbers of individuals tested are indicated next to these boxes). Cytokine production is presented as the ratio of cytokine production by stimulated cells to that by nonstimulated cells. (I) IL-8 production upon activation of SV40-transformed fibroblasts from healthy donors (C+), MyD88-deficient patients (P1 and P2), and an IRAK-4–deficient patient (IRAK4 −/−)after transfection with the pUNO empty plasmid (white), wild-type pUNO-MyD88 (gray), and wild-type pcDNA3–IRAK-4 (black). Cells were also transfected with the pcDNA3 empty plasmid, giving results similar to those of the pUNO empty plasmid (not shown). (J) IL-8 production upon activation of I3A cells (MyD88-deficient HEK293 cells) without transfection and after transfection with pcDNA3.2 empty plasmid (mock), or pcDNA3.2 encoding V5-tagged wild-type MYD88, V5-tagged MYD88-E52del, V5-tagged MYD88-L93P, and V5-tagged MYD88-R196C. RT-PCR in nonactivated (NS) and activated I3A cells (IL-1β)servedto check that the cells were correctly transfected with MYD88. Western blotting for the V5 tag was also done (fig. S8). (K) Coimmunoprecipitation in I3A cells, transfected with expression vectors encoding V5-tagged MyD88 and FLAG-tagged IRAK-4. Immunoprecipitation was carried out with V5- or FLAG-specific antibodies and Western blotting with V5-, FLAG-, or IL-1R–specific antibodies. Coimmunoprecipitation of IL-1R1 with the MyD88 mutants (left panel). MyD88-L93P and MyD88-E52del (in the DD) interact weakly with IL-1R1, whereas MyD88-R196C (in the TIR domain) cannot associate with IL-1R. Coimmunoprecipitation of IRAK-4 with MyD88 mutants (right panel). MyD88-L93P and MyD88-E52del cannot interact with IRAK-4, whereas MyD88-R196C still associates with IRAK-4.
Fig. 3
Fig. 3
(A) Multiple cytokine secretion by whole-blood cells from three healthy donors and three MyD88-deficient patients (P2, P3, and P4), activated by incubation with various TLR agonists for 24 hours. Cytokine levels are presented as ratios of secretion by cells from MyD88-deficient patients to secretion by cells from the healthy control. (B) Transcriptional profiles of fibroblasts from healthy controls and patients stimulated with IL-1β, TNF-α, and poly(I:C) for 2 hours. Transcriptional signature of 275 genes differentially regulated upon stimulation with IL-1β,TNF-α, or poly(I:C) in at least two of three control fibroblast lines. Genes were arranged by hierarchical clustering and, for each donor, changes in expression with respect to the corresponding untreated conditions are represented on a heat map. Red indicates a relative increase in expression levels, blue indicates a relative decrease, and yellow indicates no change in expression level. Samples are grouped by stimulus and ordered by donor: controls (1 to 3), IRAK-4–deficient patient (3), MyD88-deficient patient, UNC-93B–deficient patients (1 and 2) (11), STAT1-deficient patient (12), and NEMO-deficient patient (10). (C) Transcriptional profiles of fibroblasts stimulated with IL-1β, TNF-α, and poly(IC) for 8 hours. Transcriptional signature of 1451 genes differentially regulated upon stimulation with IL-1β,TNF-α, or poly(IC)in at least two of three control fibroblast lines. (D) Functional pathways regulated in fibroblasts treated with IL-1β, TNF-α, or poly(IC) for 2 hours. Genes or gene products regulated by these factors are represented as nodes, and the biological relation between two nodes is represented as an edge (line). Solid and dashed lines indicate direct and indirect relations, respectively. All edges are supported by at least one reference from the literature. Nodes are arranged according to the cellular distribution of the corresponding gene products. Expression levels of individual genes are represented on a color scale on the main network: white denotes <1.5-fold difference from nonstimulated conditions; solid red denotes >5-fold difference from nonstimulated conditions. The main network indicates the average expression level for the three control cell lines. The scaled-down networks indicate the levels of expression obtained for cells derived from patients.

References

    1. Casanova JL, Abel L. Science. 2007;317:617. - PubMed
    1. Picard C, et al. Science. 2003;299:2076. - PubMed
    1. Ku CL, et al. J. Exp. Med. 2007;204:2407. - PMC - PubMed
    1. Supporting material is available on Science Online.

    1. Suzuki N, et al. Nature. 2002;416:750. - PubMed

Publication types

MeSH terms

Associated data