. 2008 Aug 20;22(13):1561-8.
doi: 10.1097/QAD.0b013e32830a9886.

Genetic analysis implicates resistin in HIV lipodystrophy

Affiliations

Genetic analysis implicates resistin in HIV lipodystrophy

Koustubh Ranade et al. AIDS. .

Abstract

Objectives: To investigate the role of genetic variation in influencing the risk of metabolic complications associated with highly active antiretroviral therapy (HAART).

Methods: Cluster analysis of metabolic traits of 189 patients enrolled in ACTG5005s, the metabolic substudy of ACTG384, a clinical trial of HAART, was performed to identify a subgroup of individuals with increased risk of developing a cluster of metabolic abnormalities after exposure to HAART. Almost 300 single nucleotide polymorphisms in 135 candidate genes were evaluated for their association with this subgroup.

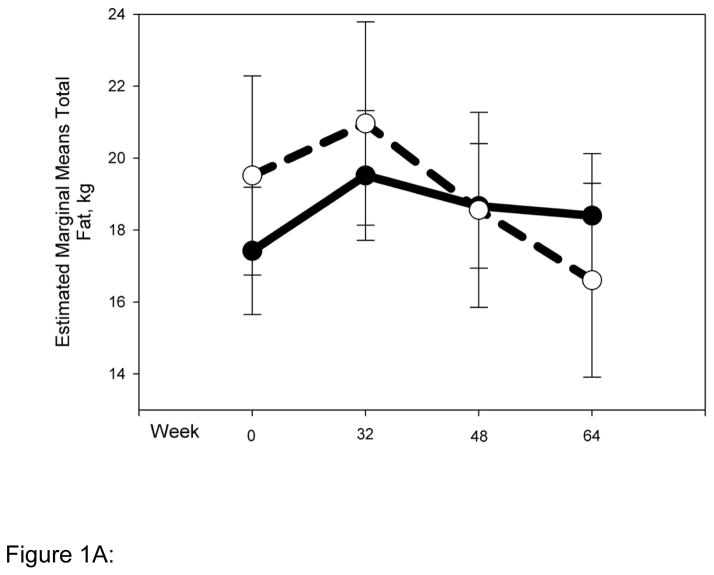
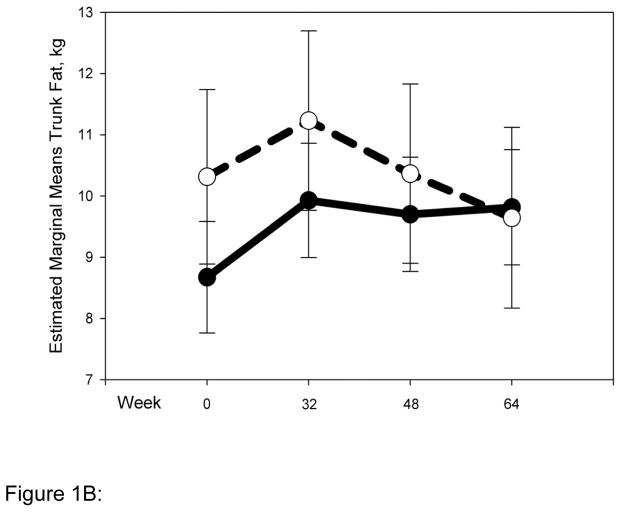
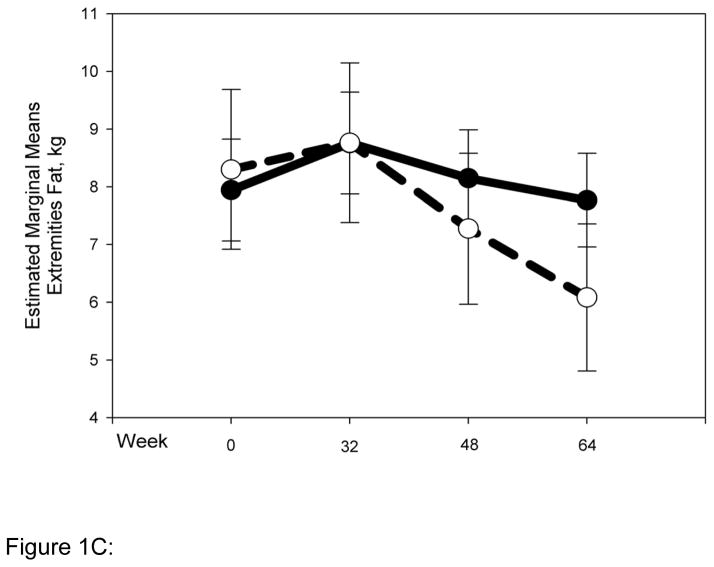
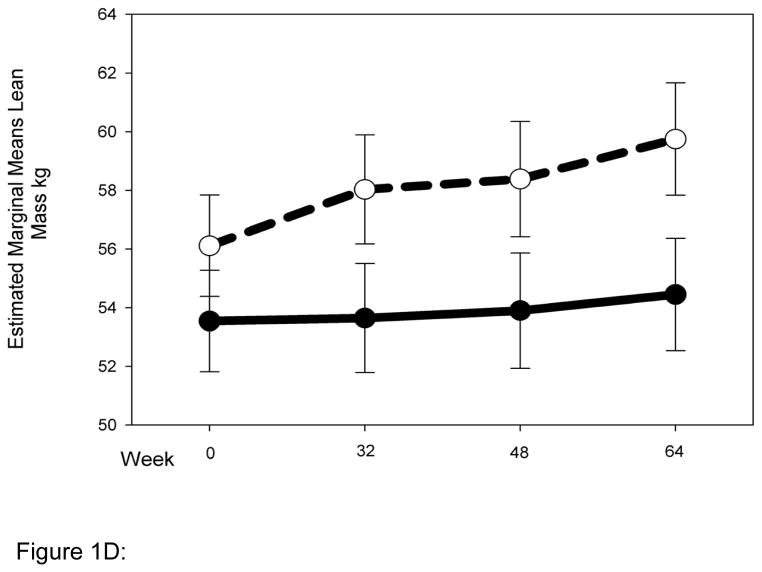
Results: A subgroup of patients was identified that had a normal metabolic profile at baseline but developed significantly elevated lipids and insulin resistance on HAART. This high-risk subgroup of patients also experienced significant body composition changes, particularly limb fat loss. Candidate gene analysis revealed that a single nucleotide polymorphism in resistin, a gene previously implicated in obesity and insulin resistance, was associated with this high-risk group (P = 0.0003).

Conclusion: Genetic variation in resistin is associated with metabolic complications caused by HAART.


Conflict of interest statement

Competing interests

KR, OF, WG are employees of Bristol-Myers Squibb Co. MN is currently employed by GlaxoSmithKline.

Figures

Figure 1
Figure 1
Normal (N = 54) and high-risk (N = 22) clusters show markedly different body composition responses to HAART. Changes in body composition over time and interaction with clusters were analyzed using repeated measures ANOVA. Solid and dashed lines indicate values for the normal and high-risk clusters respectively. Error bars represent standard error of the mean. Although natural log transformed total, trunk and limb fat values were used in the repeated measures ANOVA to determine significance, for clarity untransformed values are provided in the graph (A) Total fat (P value for interaction with clusters = 0.01) (B) Trunk fat (P = 0.11) (C) Limb fat (P = 0.001) (D) Lean mass (P = 0.009). Figure 1A: Change in total fat by cluster Figure 1B: Change in trunk fat by cluster Figure 1C: Change in limb fat by cluster Figure 1D: Change in lean mass by cluster
Figure 1
Figure 1
Normal (N = 54) and high-risk (N = 22) clusters show markedly different body composition responses to HAART. Changes in body composition over time and interaction with clusters were analyzed using repeated measures ANOVA. Solid and dashed lines indicate values for the normal and high-risk clusters respectively. Error bars represent standard error of the mean. Although natural log transformed total, trunk and limb fat values were used in the repeated measures ANOVA to determine significance, for clarity untransformed values are provided in the graph (A) Total fat (P value for interaction with clusters = 0.01) (B) Trunk fat (P = 0.11) (C) Limb fat (P = 0.001) (D) Lean mass (P = 0.009). Figure 1A: Change in total fat by cluster Figure 1B: Change in trunk fat by cluster Figure 1C: Change in limb fat by cluster Figure 1D: Change in lean mass by cluster

References

    1. Carr A, Samaras K, Burton S, Law M, Freund J, Chisholm DJ, et al. A syndrome of peripheral lipodystrophy, hyperlipidaemia and insulin resistance in patients receiving HIV protease inhibitors. AIDS. 1998;12:F51–8. - PubMed
    1. Grinspoon S, Carr A. Cardiovascular risk and body fat abnormalities in HIV infected individuals. N Engl J Med. 2005;352:48–62. - PubMed
    1. Friis-Moller N, Sabin CA, Weber R, d’Arminio Monforte A, El-Sadr WM, Reiss P, et al. Combination anti-retroviral therapy and the risk of myocardial infarction. N Engl J Med. 2003;349:1993–2003. - PubMed
    1. Purnell JQ, Zambon A, Knopp RH, Pizzuti DJ, Achari R, Leonard JM, et al. Effect of ritonavir on lipids and post-heparin lipase activities in normal subjects. AIDS. 2000;14:51–7. - PubMed
    1. Jemsek JG, Arathoon E, Arlotti M, Perez C, Sosa N, Pokrovskiy V, et al. Body fat and other metabolic effects of atazanavir and efavirenz, each administered in combination with zidovudine plus lamivudine, in antiretroviral-naive HIV-infected patients. Clin Infect Dis. 2006;42:273–80. - PubMed

Publication types

MeSH terms