

Lung perfusion imaging can risk stratify lung cancer patients for the development of pulmonary complications after chemoradiation
- PMID: 18670303
- PMCID: PMC4110902
- DOI: 10.1097/JTO.0b013e31818020d5
Lung perfusion imaging can risk stratify lung cancer patients for the development of pulmonary complications after chemoradiation
Abstract
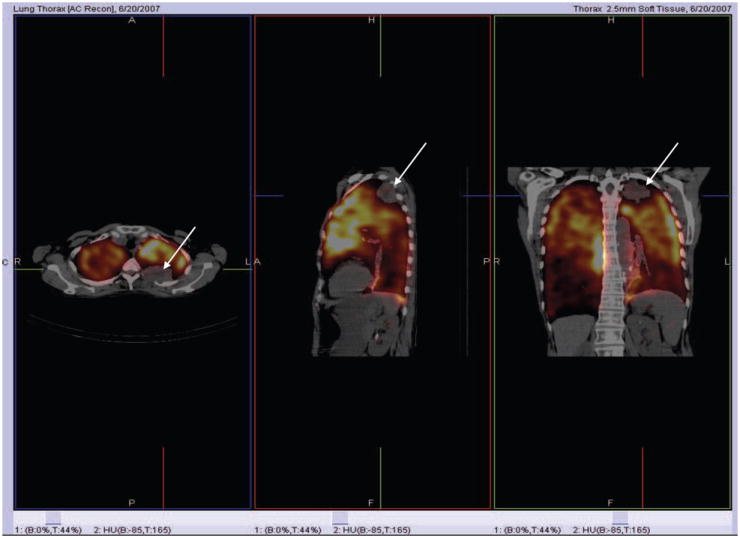
Introduction: We investigated the value of lung perfusion imaging in predicting the risk of developing pulmonary complications after chemoradiation (CRT) or radiation therapy (RT) for lung cancer.
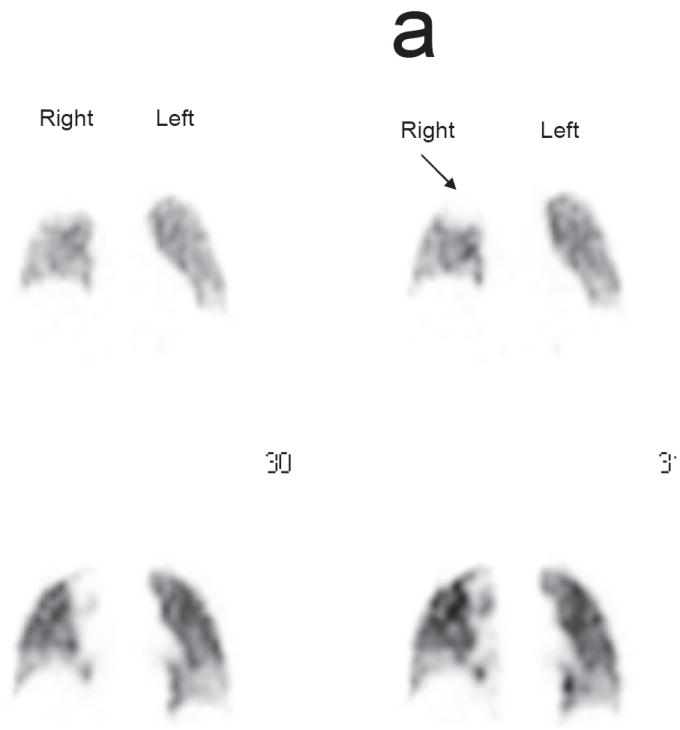
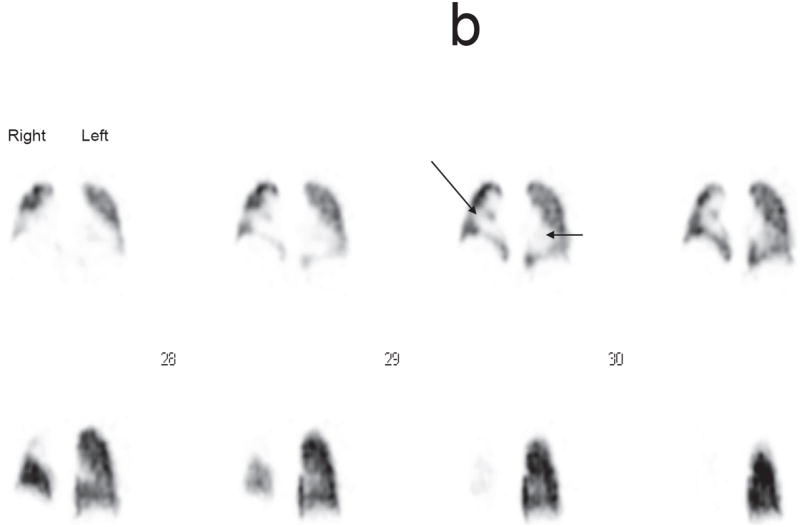
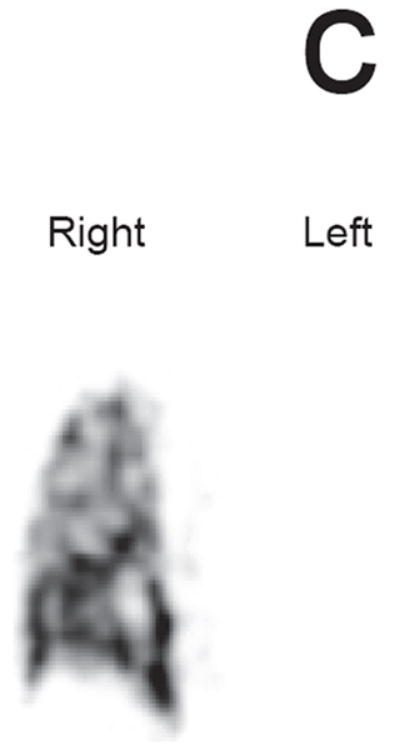
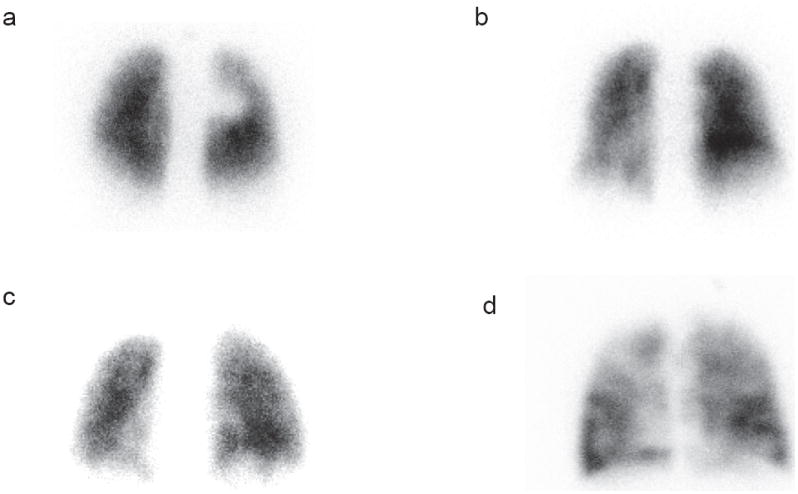
Methods: Fifty patients who underwent lung perfusion imaging before RT for lung cancer were included. Planar and single photon emission computed tomography/computed tomography images of the lungs were obtained. Lung perfusion score (LPS) was developed to visually grade localized perfusion defect per lung on a scale of 0 to 4 and perfusion pattern in the remaining lungs on a scale of 1 to 4. The LPS is the sum of the score for the localized perfusion defect in each lung plus the score for the remaining lungs perfusion. LPSs were correlated with pulmonary function tests and the patients were followed for 8 months after therapy to determine the incidence of grade 2 to 5 symptomatic therapy related pulmonary complications according to the common terminology criteria for adverse events (CTCAE 3.0).
Results: Thirty-four patients underwent CRT and 16 underwent RT. The mean total radiation dose delivered was 56.1 +/- 10.4 Gy. Eighteen patients (36%) suffered from pulmonary complications at a mean interval of 3.4 months after therapy. Nine patients had grade 2, 7 had grade 3, 1 had grade 4, and 1 had grade 5 pulmonary complications. The mean LPS was 4.9 in patients who developed pulmonary complications versus 3.5 in patients who did not (p = 0.01). There were no significant difference between pulmonary function tests in the patients with pulmonary complications and the patient without. In addition, there were no significant differences between the mean lung radiation dose, the volume of lung irradiated or the percentage of lung receiving greater than 20 Gy between the two groups.
Conclusions: LPS using lung perfusion imaging is useful for predicting possible pulmonary complications after CRT or RT in lung cancer patients.
Figures
References
-
- Roach M, III, Gandara DR, Yuo HS, et al. Radiation pneumonitis following combined modality therapy for lung cancer: analysis of prognostic factors. J Clin Oncol. 1995;10:2606–12. - PubMed
-
- Marks LB, Spencer DP, Sherouse GW, et al. The role of three dimensional functional lung imaging in radiation treatment planning: the functional dose-volume histogram. Int J Radiat Oncol Biol Phys. 1995;33(1):65–75. - PubMed
-
- Boersma LJ, Damen EM, de Boer RW, et al. A new method to determine dose-effect relations for local lung-function changes using correlated SPECT and CT data. Radiother Oncol. 1993;29(2):110–6. - PubMed
-
- Fu X-L, Huang H, Bentel G, Clough R, et al. Predicting the risk of symptomatic radiation-induced lung injury using both the physical and biologic parameters V (30) and transforming growth factor beta. Int J Radiat Oncol Biol Phys. 2001;5(4):899–908. - PubMed
-
- Marks LB, Munley M, Spencer D, et al. Quantification of radiation-induced regional lung injury with perfusion imaging. Int J Radiat Oncol Biol Phys. 1997;38(2):399–409. - PubMed
MeSH terms
Grants and funding
LinkOut - more resources
Full Text Sources
Medical
Research Materials
