. 2008 Aug;10(8):897-907.
doi: 10.1593/neo.08428.

Homozygous deletions and recurrent amplifications implicate new genes involved in prostate cancer

Affiliations
Free PMC article

Homozygous deletions and recurrent amplifications implicate new genes involved in prostate cancer

Wennuan Liu et al. Neoplasia. 2008 Aug.
Free PMC article

Abstract

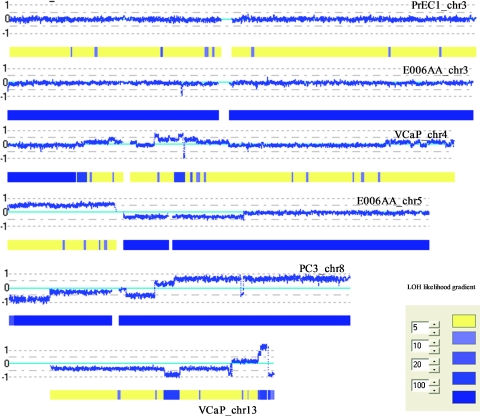
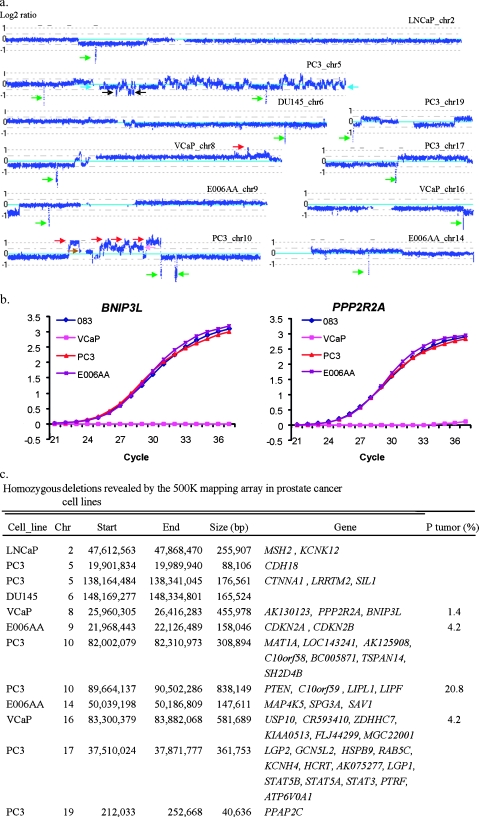
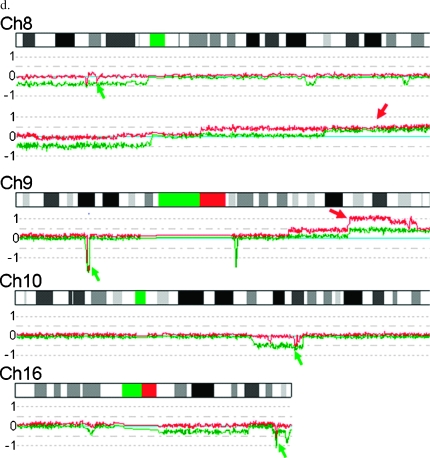
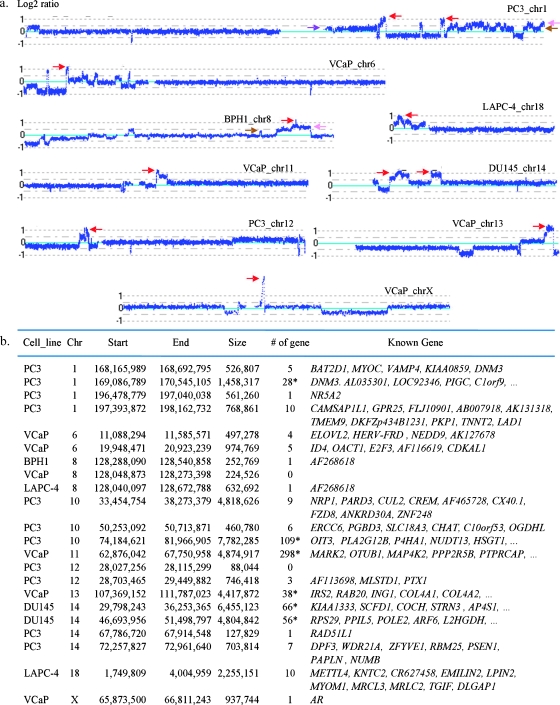
Prostate cancer cell lines provide ideal in vitro systems for the identification and analysis of prostate tumor suppressors and oncogenes. A detailed characterization of the architecture of prostate cancer cell line genomes would facilitate the study of precise roles of various genes in prostate tumorigenesis in general. To contribute to such a characterization, we used the GeneChip 500K single nucleotide polymorphic (SNP) array for analysis of genotypes and relative DNA copy number changes across the genome of 11 cell lines derived from both normal and cancerous prostate tissues. For comparison purposes, we also examined the alterations observed in the cell lines in tumor/normal pairs of clinical samples from 72 patients. Along with genome-wide maps of DNA copy number changes and loss of heterozygosity for these cell lines, we report previously unreported homozygous deletions and recurrent amplifications in prostate cancers in this study. The homozygous deletions affected a number of biologically important genes, including PPP2R2A and BNIP3L identified in this study and CDKN2A/CDKN2B reported previously. Although most amplified genomic regions tended to be large, amplifications at 8q24.21 were of particular interest because the affected regions are relatively small, are found in multiple cell lines, are located near MYC, an oncogene strongly implicated in prostate tumorigenesis, and are known to harbor SNPs that are associated with inherited susceptibility for prostate cancer. The genomic alterations revealed in this study provide an important catalog of positional information relevant to efforts aimed at deciphering the molecular genetic basis of prostate cancer.


Figures

Figure 1
Figure 1
Examples of DNA copy number changes and LOH identified by CNAG2.0. Log2 ratios (horizontal dotted lines) are labeled for each of the chromosomes on the left as 1, 0, and -1, with 0 being the baseline (light blue). Dark blue curve indicates 10-SNP genomic smoothed log2 ratios of Nsp probes. Blue bars superimposed on the yellow bars represent LOH likelihood with the likelihood gradients labeled on the left.
Figure 2
Figure 2
Homozygous deletions identified in PCa cell lines. (a) Log2 ratios (horizontal dot lines) are labeled for each of the chromosomes on the left as 1, 0, and -1, with 0 being the baseline (light blue). Dark blue curve indicates 10-SNP genomic smoothed log2 ratios of the 500K probes. Green arrows indicate homozygous deletion. Red arrow indicates amplifications with three or more extra copies. Light blue arrow indicates one-copy loss. Black arrow indicates two-copy loss. Brown arrow indicates one-extra-copy gain. Pink arrow indicates two-extra-copy gain. (b) Validation of homozygous deletions in PCa cell lines using qPCR. The raw signal intensities for each of the test loci were normalized against the signal intensity of control locus (GAPDH) with normal copy numbers for each of the cycles. The normalized relative signal intensities (Y-axis) are plotted for each of the PCR cycles (X-axis), with 083 from normal blood DNA used as a reference. No signals of PPP2R2A and BNIP3 detected in VCaP indicate complete loss of these two genes. (c) Physical locations and genes involved in homozygous deletions. Chr indicates chromosome; P tumor, clinical sample. (d) Examples of recurrent homozygous deletions (green arrows) and biallelic gains (red arrows) identified in different clinical samples by allele-specific analysis. Log2 ratios of the two alleles (red and green curves) are labeled for each of the chromosomes on the left as 1, 0, and -1, with 0 being the baseline (light blue). G6, G7, G8, and G9 represent Gleason scores of 6, 7, 8, and 9, respectively, for different subjects.
Figure 2
Figure 2
Homozygous deletions identified in PCa cell lines. (a) Log2 ratios (horizontal dot lines) are labeled for each of the chromosomes on the left as 1, 0, and -1, with 0 being the baseline (light blue). Dark blue curve indicates 10-SNP genomic smoothed log2 ratios of the 500K probes. Green arrows indicate homozygous deletion. Red arrow indicates amplifications with three or more extra copies. Light blue arrow indicates one-copy loss. Black arrow indicates two-copy loss. Brown arrow indicates one-extra-copy gain. Pink arrow indicates two-extra-copy gain. (b) Validation of homozygous deletions in PCa cell lines using qPCR. The raw signal intensities for each of the test loci were normalized against the signal intensity of control locus (GAPDH) with normal copy numbers for each of the cycles. The normalized relative signal intensities (Y-axis) are plotted for each of the PCR cycles (X-axis), with 083 from normal blood DNA used as a reference. No signals of PPP2R2A and BNIP3 detected in VCaP indicate complete loss of these two genes. (c) Physical locations and genes involved in homozygous deletions. Chr indicates chromosome; P tumor, clinical sample. (d) Examples of recurrent homozygous deletions (green arrows) and biallelic gains (red arrows) identified in different clinical samples by allele-specific analysis. Log2 ratios of the two alleles (red and green curves) are labeled for each of the chromosomes on the left as 1, 0, and -1, with 0 being the baseline (light blue). G6, G7, G8, and G9 represent Gleason scores of 6, 7, 8, and 9, respectively, for different subjects.
Figure 3
Figure 3
Examples of amplifications with three or more extra copies identified in PCa cell lines. (a) Log2 ratios (horizontal dot lines) are labeled for each of the chromosomes on the left as 1, 0, and -1, with 0 being the baseline (light blue). Red arrow indicates amplification with three or more extra copies. Brown arrow indicates one-extra-copy gain. Pink arrow indicates two-extra-copy gain. (b) Physical locations and genes involved in amplification. An asterisk (*) represents a known gene item count from the UCSC Table Browser utility (University of California, Santa Cruz, CA).
Figure 4
Figure 4
Validation of amplifications in PCa cell lines using qPCR and FISH. Amplifications of RAB20 (a), OTUB1 (b), ING1 (d), MARK2 (e), and a locus at 8q24 (c and f) confirmed by qPCR. Cycle numbers (Ct) of the control (GAPDH; X-axis) with normal copy number and test amplicons (Y-axis) for the three dilutions of each DNA sample were plotted against each other and the offset between the reference sample (083-003; blue) and DNA from cell lines (red). Fluorescent in situ hybridization analysis of DNA copy number of AR in a normal male control cell line (g) and in the PCa cell line E006AA (h and i). Green indicates the X centromere probe. Red indicates the AR probe at Xq12. Metaphase analysis of E006AA indicated two copies of X centromere (green) and what seem to be multiple copies of the AR gene (red).

References

    1. Bernardino J, Bourgeois CA, Muleris M, Dutrillaux AM, Malfoy B, Dutrillaux B. Characterization of chromosome changes in two human prostatic carcinoma cell lines (PC-3 and DU145) using chromosome painting and comparative genomic hybridization. Cancer Genet Cytogenet. 1997;96:123–128. - PubMed
    1. Nupponen NN, Hyytinen ER, Kallioniemi AH, Visakorpi T. Genetic alterations in prostate cancer cell lines detected by comparative genomic hybridization. Cancer Genet Cytogenet. 1998;101:53–57. - PubMed
    1. Virgin JB, Hurley PM, Nahhas FA, Bebchuk KG, Mohamed AN, Sakr WA, Bright RK, Cher ML. Isochromosome 8q formation is associated with 8p loss of heterozygosity in a prostate cancer cell line. Prostate. 1999;41:49–57. - PubMed
    1. Aurich-Costa J, Vannier A, Gregoire E, Nowak F, Cherif D. IPM-FISH, a new M-FISH approach using IRS-PCR painting probes: application to the analysis of seven human prostate cell lines. Genes Chromosomes Cancer. 2001;30:143–160. - PubMed
    1. Clark J, Edwards S, Feber A, Flohr P, John M, Giddings I, Crossland S, Stratton MR, Wooster R, Campbell C, et al. Genome-wide screening for complete genetic loss in prostate cancer by comparative hybridization onto cDNA microarrays. Oncogene. 2003;22:1247–1252. - PubMed

Publication types

MeSH terms