. 2008 Oct 10;510(5):484-96.
doi: 10.1002/cne.21807.

Probing neurochemical structure and function of retinal ON bipolar cells with a transgenic mouse

Affiliations

Probing neurochemical structure and function of retinal ON bipolar cells with a transgenic mouse

Anuradha Dhingra et al. J Comp Neurol. .

Abstract

Retinal ON bipolar cells make up about 70% of all bipolar cells. Glutamate hyperpolarizes these cells by binding to the metabotropic glutamate receptor mGluR6, activating the G-protein G(o1), and closing an unidentified cation channel. To facilitate investigation of ON bipolar cells, we here report on the production of a transgenic mouse (Grm6-GFP) in which enhanced green fluorescent protein (EGFP), under control of mGluR6 promoter, was expressed in all and only ON bipolar cells. We used the mouse to determine density of ON bipolar cells, which in central retina was 29,600 cells/mm(2). We further sorted the fluorescent cells and created a pure ON bipolar cDNA library that was negative for photoreceptor unique genes. With this library, we determined expression of 27 genes of interest. We obtained positive transcripts for G(o) interactors: regulators of G-protein signaling (RGS), Ret-RGS1 (a variant of RGS20), RGS16, RGS7, purkinje cell protein 2 (PCP2, also called L7 or GPSM4), synembryn (RIC-8), LGN (GPSM2), RAP1GAP, and Gbeta5; cGMP modulators: guanylyl cyclase (GC) 1alpha1, GC1beta1, phosphodiesterase (PDE) 1C, and PDE9A; and channels: inwardly rectifying potassium channel Kir2.4, transient receptor potential TRPC2, and sperm-specific cation channels CatSper 2-4. The following transcripts were not found in our library: AGS3 (GPSM1), RGS10, RGS19 (GAIP), calbindin, GC1alpha2, GC1beta2, PDE5, PDE2A, amiloride-sensitive sodium channel ACCN4, and CatSper1. We then localized Kir2.4 to several cell types and showed that, in ON bipolar cells, the channel concentrates in their dendritic tips. The channels and modulators found in ON bipolar cells likely shape their light response. Additional uses of the Grm6-GFP mouse are also discussed.


Figures

Fig. 1
Fig. 1. EGFP is expressed exclusively in all ON bipolar cells (Grm6-GFP, mouse line 5)
Images are radial sections of line 5 retina stained for G-γ13 (red). Upper row, low magnification; projection of 3 consecutive confocal planes. Lower row, a single confocal plane of INL at higher magnification. All cells stained for G-γ13 were EGFP-positive and vice versa. In case staining was not evident in a particular section, it became evident in sequential sections. A–C were photographed under 40x oil immersion objective NA 1.25. ONL, outer nuclear layer; OPL, outer plexiform layer; INL, inner nuclear layer; IPL, inner plexiform layer; GCL, ganglion cell layer; a, the OFF sublamina; b, the ON sublamina.
Fig. 2
Fig. 2. Density of ON bipolar cells varies little across eccentricity
A–C. Tangential view of line 5 retina at the level of the INL (A), sublamina a of the IPL (B), and sublamina b of the IPL (C). Because the fields are slightly slanted, structures on the left are deeper in the retina. For example in C, the left field images sublamina 5 where large structures belonging to rod bipolar terminals are seen, while the right field images sublaminas 3 and 4 with smaller terminals of ON cone bipolar cells. D. ON bipolar cell density vs. distance from the optic disk (OD); distance of 0 defined as the edge of the disk. All points are temporal to the disc except the X at 100 µm, which is nasal. Different symbols are from different mice.
Fig. 3
Fig. 3. Grm6-GFP transgenic mouse (line 1) shows a mosaic expression of EGFP in ON bipolar cells
A. A low magnification radial section (projection of 2 confocal planes) of line 1 retina showing that EGFP is restricted to cells whose somas lie at the upper tiers of the INL and whose axons arborize in sublamina b. B. A radial section stained for G-γ13 (red). All EGFP-positive cells are stained for G-γ13 (double arrowheads), indicating that they are all ON bipolar cells. However, many G-γ13-positive cells are EGFP-negative (arrows) indicating that not all ON bipolar cells are marked by EGFP in this mouse line. C. A radial section stained for PKC (red). Many PKC-positive cells are EGFP-negative (arrows). Double arrowheads point to EGFP-positive rod bipolar cells, and asterisks indicate EGFP-positive ON cone bipolar cells.
Fig. 4
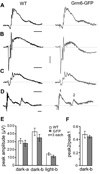
Fig. 4. ERG of Grm6-GFP transgenic mouse (line 5) is similar to that of wild type
A–D. ERG responses of wild type mouse (wt, black traces) and Grm6-GFP mouse (gray traces). Scale bar for time is 100 ms and for voltage is 100 µV. A. Responses to dim flashes (30 R*/rod) under dark-adapted conditions. B. Responses to an intense flash (105 R*/rod, isomerizing ∼0.1% of the rhodopsin) under dark-adapted conditions. C. Responses to an intense flash (105 R*/rod) under light-adapted background (white light, 5.3 × 10⁴ R*/rod/s) that completely suppressed the rod driven current. D. Test of ERG response recovery: a dim flash (30 R*/rod) under dark-adapted background was followed by a second dim flash at an interval of 350 ms. The amplitude of the second response was smaller than that of the first and recovered to its original size after about 500 ms. E and F. Comparing the ERG parameters of wild-type and Grm6-GFP mice. Error bar shows standard error. E. Comparison of a- and b-wave amplitudes under dark- and light-adapted conditions. The small differences were insignificant; n=3 mice, 6 eyes, for each group. F. Ratio of the peak amplitude of the 2nd b-wave to that of the 1st. The difference was not significant (n=3).
Fig. 5
Fig. 5. ON bipolar cDNA library is pure
A, B. Two examples of dissociated ON bipolar cells. C, D. Two examples of cells that were sorted by FACS: top images are DIC and bottom images are fluorescent. In C examples, all four FACS-sorted cells express EGFP. In D, there are 8 cells (bright white speckles are DIC artifacts); one is EGFP-negative (*) and one is very faint. Scale bars are 10 µm. E–G. PCR products used to test the library. E. Gαo1 was amplified as positive control for purity testing. F, G. Photoreceptor genes were amplified to test purity. Con, control used water instead of DNA; bp, ON bipolar cDNA library; ret, retinal cDNA; rd, rd retina cDNA library; CNGA1, rod cGMP-gated channel; CNGA3, cone cGMP-gated channel. E and G come from the same gel.
Fig. 6
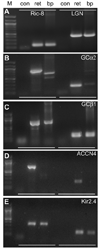
Fig. 6. Representative PCR products
PCR products were amplified from the bipolar cDNA library (bp) using transcript-specific primers. Transcripts are specified above the lanes in A, and on the right for β-E. For all panels except A, the left three lanes show product amplified with primer set 1 (the top rows for each transcript in Table 1) and the right three show product amplified with primer set 2 (the lower rows in Table 1). Negative control (con) used water instead of DNA, and positive control used retinal cDNA (ret). Left lanes are 100 bp markers (M) with top bright band at 1000 bp and bottom bright band at 500 bp. In B (GC1α2), the PCR product that was amplified from retina with primer set 1 was sequenced and found to be correct, while that amplified from bipolar library was sequenced and found to be incorrect.
Fig. 7
Fig. 7. CatSper-null mice show normal ERG responses to light stimuli
A. Response of CatSper 4-null mouse to an intense flash (105 R*/rod, isomerizing ∼0.1% of the rhodopsin) under dark-adapted conditions. B. Response of the same animal to an intense flash (105 R*/rod) under light-adapted conditions (background intensity = 5.3 × 10⁴ R*/rod/s). C. Response recovery of another CatSper4-null mouse under dark-adapted conditions. The stimulus consisted of two consecutive flashes (30 R*/rod) with an inter-flash interval of 300 ms. D. Ratio of the amplitude of the 2nd b-wave to that of the 1st as a function of inter-stimulus interval. The recovery of the 2nd response was similar for wild type (n=2), CatSper3-null (n=1), and CatSper4-null (n=2) mice, with an average recovery time of 500 ms. Time scale bar is 100 ms.
Fig. 8
Fig. 8. Kir2.4 is expressed throughout the retina and in ON bipolar dendritic tips
A, B. HEK cells were transfected with Kir2.4 cloned from retina and immunostained with anti-Kir2.4. The antibody recognizes Kir2.4 and gives no background in untransfected cells. A, fluorescent image, immunostaining visualized with FITC; B, DIC image with merged fluorescence. C. Western blots of HEK cells transfected with Kir2.4 (Kir2.4), HEK cells transfected with two different empty vectors (Vec1 and Vec2), and retinal homogenate (Ret). The same two bands appear in HEK cells and retina. Faint non-specific bands appear only in HEK cells. D. Wild type mouse retina immunostained for Kir2.4. All cell types are stained; this picture represents a collapse of 3 confocal optical planes (taken with a 40x oil immersion objective NA 1.3). E–G. Grm6-GFP retina (with EGFP in ON bipolar cells; green) stained for Kir 2.4 (magenta) showing higher magnification of OPL and INL: punctate staining in OPL is present in dendritic tips of ON bipolar cells; puncta in INL mainly localized to the edge of the somas. These pictures are from a single confocal optical plane taken with a 60x oil immersion objective (NA 1.42).

Similar articles

Cited by

References

    1. Andreeva SG, Dikkes P, Epstein PM, Rosenberg PA. Expression of cGMP-specific phosphodiesterase 9A mRNA in the rat brain. J Neurosci. 2001;21:9068–9076. - PMC - PubMed
    1. Ayoub GS, Korenbrot JI, Copenhagen DR. The release of endogenous glutamate from isolated cone photoreceptors of the lizard. Neurosci Res. 1989;10(Suppl):547–556. - PubMed
    1. Bender AT, Beavo JA. Cyclic nucleotide phosphodiesterases: molecular regulation to clinical use. Pharmacol Rev. 2006;58:488–520. - PubMed
    1. Berrebi AS, Oberdick J, Sangameswaran L, Christakos S, Morgan JI, Mugnaini E. Cerebellar Purkinje cell markers are expressed in retinal bipolar neurons. J Comp Neurol. 1991;308:630–649. - PubMed
    1. Blute TA, Velasco P, Eldred WD. Functional localization of soluble guanylate cyclase in turtle retina: modulation of cGMP by nitric oxide donors. Vis Neurosci. 1998;15:485–498. - PubMed

Publication types

MeSH terms

LinkOut - more resources