. 2008 Jul 31:9:366.
doi: 10.1186/1471-2164-9-366.

Gene networks driving bovine milk fat synthesis during the lactation cycle

Affiliations

Gene networks driving bovine milk fat synthesis during the lactation cycle

Massimo Bionaz et al. BMC Genomics. .

Abstract

Background: The molecular events associated with regulation of milk fat synthesis in the bovine mammary gland remain largely unknown. Our objective was to study mammary tissue mRNA expression via quantitative PCR of 45 genes associated with lipid synthesis (triacylglycerol and phospholipids) and secretion from the late pre-partum/non-lactating period through the end of subsequent lactation. mRNA expression was coupled with milk fatty acid (FA) composition and calculated indexes of FA desaturation and de novo synthesis by the mammary gland.

Results: Marked up-regulation and/or % relative mRNA abundance during lactation were observed for genes associated with mammary FA uptake from blood (LPL, CD36), intracellular FA trafficking (FABP3), long-chain (ACSL1) and short-chain (ACSS2) intracellular FA activation, de novo FA synthesis (ACACA, FASN), desaturation (SCD, FADS1), triacylglycerol synthesis (AGPAT6, GPAM, LPIN1), lipid droplet formation (BTN1A1, XDH), ketone body utilization (BDH1), and transcription regulation (INSIG1, PPARG, PPARGC1A). Change in SREBF1 mRNA expression during lactation, thought to be central for milk fat synthesis regulation, was < or =2-fold in magnitude, while expression of INSIG1, which negatively regulates SREBP activation, was >12-fold and had a parallel pattern of expression to PPARGC1A. Genes involved in phospholipid synthesis had moderate up-regulation in expression and % relative mRNA abundance. The mRNA abundance and up-regulation in expression of ABCG2 during lactation was markedly high, suggesting a biological role of this gene in milk synthesis/secretion. Weak correlations were observed between both milk FA composition and desaturase indexes (i.e., apparent SCD activity) with mRNA expression pattern of genes measured.

Conclusion: A network of genes participates in coordinating milk fat synthesis and secretion. Results challenge the proposal that SREBF1 is central for milk fat synthesis regulation and highlight a pivotal role for a concerted action among PPARG, PPARGC1A, and INSIG1. Expression of SCD, the most abundant gene measured, appears to be key during milk fat synthesis. The lack of correlation between gene expression and calculated desaturase indexes does not support their use to infer mRNA expression or enzyme activity (e.g., SCD). Longitudinal mRNA expression allowed development of transcriptional regulation networks and an updated model of milk fat synthesis regulation.


Figures
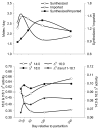
Figure 1
Figure 1
De novo vs. imported FA and Δ9 desaturase indexes. De novo FA synthesis (Synthesized) vs FA import (Imported) analysis (Top panel) and Δ9 desaturase indexes during lactation (Bottom panel). Synthesized = FA with 4÷14 carbons except 11:1; pooled SEM = 0.34. Imported from blood = FA with carbon chain >16 plus 15:0 and 11:1; pooled SEM = 0.31. Synthesized/Imported, pooled SEM = 0.10. Pooled SEM for Δ9 activity on 14:0, 16:0, 18:0, and trans11-18:1 was 0.008, 0.007, 0.02, and 0.06, respectively. Statistical effect of time: P < 0.05 for all measurements except Synthesized FA (P = 0.24) and Δ9 activity on 18:0 (P = 0.77).
Figure 2
Figure 2
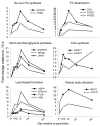
Genes involved in FA uptake, activation, intracellular trafficking, and xenobiotic and cholesterol transport. Temporal expression patterns in bovine mammary of genes involved in FA uptake (LPL, SEM = 8.0; CD36, SE = 0.97; VLDR; SEM = 0.72), FA and acyl-CoA transport (FABP3, SEM = 6.18; ACBP, SE = 0.11), short- and long-chain FA activation (ACSS1, SEM = 0.95; ACSS2, SEM = 1.66; ACSL1, SEM = 0.61), and xenobiotic and cholesterol transport (ABCA1, SEM = 0.22; ABCG2, SEM = 2.69). Statistical effect of time: P < 0.05 for all genes except ABCA1 (P = 0.06).
Figure 3
Figure 3
Genes involved in de novo FA synthesis, LCFA desaturation, TAG synthesis, lipid droplet formation, and BHBA utilization. Temporal expression patterns in bovine mammary of genes involved in de novo FA synthesis (ACACA, SEM = 0.62; FASN, SEM = 0.33), long-chain FA desaturation (SCD, SEM = 6.20; FADS1, SEM = 1.74; FADS2, SEM = 0.36), TAG synthesis (GPAM, SEM = 0.96; AGPAT6, SEM = 1.24; LPIN1, SEM = 3.9; DGAT1, SEM = 0.16; DGAT2, SEM = 0.86), lipid droplet formation (ADFP, SE = 0.23; BTN1A1, SEM = 1.10; PLIN, SEM = 1.29;XDH, SEM = 0.90), and ketone body utilization (BDH1, SEM = 8.60; OXCT1, SEM = 0.54). Statistical effect of time: P < 0.05 for all genes except PLIN (P = 0.17) and DGAT2 (P = 0.54).
Figure 4
Figure 4
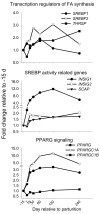
Regulation of transcription in bovine mammary. Temporal expression patterns in bovine mammary of genes involved in regulation of transcription (SREBF1, SEM = 0.18; SREBF2, SEM = 0.36; THRSP, SEM = 0.49; INSIG1, SEM = 1.30; INSIG2, SEM = 0.18; SCAP, SEM = 0.08; PPARG, SEM = 0.43; PPARGC1A, SEM = 6.6; PPARGC1B, SEM = 0.09). Statistical effect of time: P < 0.05 for all genes
Figure 5
Figure 5
Genes involved in sphingolipid synthesis in bovine mammary. Temporal expression patterns in bovine mammary of genes involved in sphingolipid synthesis (SPTLC1, SEM = 0.10; SPTLC2, SEM = 0.08; LASS2, SEM = 0.14; SPHK2, SEM = 0.10; ASAHL, SEM = 0.10; SGPL1, SEM = 0.13; UGCG, SEM = 0.17; OSBP, SEM = 0.13; OSBPL2, SEM = 0.10; OSBPL10, SEM = 0.09). Statistical effect of time: P < 0.05 for all genes except SGPL1 (P = 0.63) and SPHK2 (P = 0.65).
Figure 6
Figure 6
Networks among genes involved in milk fat synthesis. Networks were developed with Ingenuity Pathway Analysis® (Ingenuity Systems, ) and edited to incorporate results from the present and previous studies in bovine mammary tissue. Red nodes denote positive fold changes and green nodes negative fold changes in expression at 60 relative to -15 d. Red, blue, and green edges denote genes whose transcription is under the control of SREBF1, SREBF2, and PPARG, respectively. Highlighted in orange is the network encompassing PPARG, PPARGC1A, LPIN1, INSIG1, and SCAP which controls expression/function of SREBF proteins. Letters along the edges denote effects on activity (A), expression (E), localization (LO), proteolysis (L), RNA binding (RB), protein-DNA binding (PD), and protein-protein binding (PP). Genes are grouped based on their primary function during milk fat synthesis.
Figure 7
Figure 7
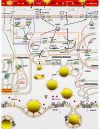
Interrelationships among cellular pathways regulating milk fat synthesis in bovine mammary tissue. Detailed description of the model is reported in the discussion section. Protein structures, when available, are the most updated from ModBase .

References

    1. Bauman DE, Mather IH, Wall RJ, Lock AL. Major advances associated with the biosynthesis of milk. J Dairy Sci. 2006;89:1235–1243. - PubMed
    1. Bauman DE, Davis CL. Biosynthesis of milk fat. In: Larson BL, Smith VR, editor. Lactation: a comprehensive treatise. Vol. 2. New York: Academic Press; 1974. pp. 31–75.
    1. Keenan TW, Mather IH. Intracellular Origin of Milk Fat Globules and the Nature of the Milk Fat Globule Membrane. In: Fox PF, McSweeney PLH, editor. Advanced Dairy Chemistry: Lipids. Vol. 2. New York, NY: Springer; 2006. pp. 137–171.
    1. Kay JK, Weber WJ, Moore CE, Bauman DE, Hansen LB, Chester-Jones H, Crooker BA, Baumgard LH. Effects of week of lactation and genetic selection for milk yield on milk fatty acid composition in Holstein cows. J Dairy Sci. 2005;88:3886–3893. - PubMed
    1. Garnsworthy PC, Masson LL, Lock AL, Mottram TT. Variation of milk citrate with stage of lactation and de novo fatty acid synthesis in dairy cows. J Dairy Sci. 2006;89:1604–1612. - PubMed

Publication types