

Closing the phenotypic gap between transformed neuronal cell lines in culture and untransformed neurons
- PMID: 18672002
- PMCID: PMC2586177
- DOI: 10.1016/j.jneumeth.2008.06.031
Closing the phenotypic gap between transformed neuronal cell lines in culture and untransformed neurons
Abstract
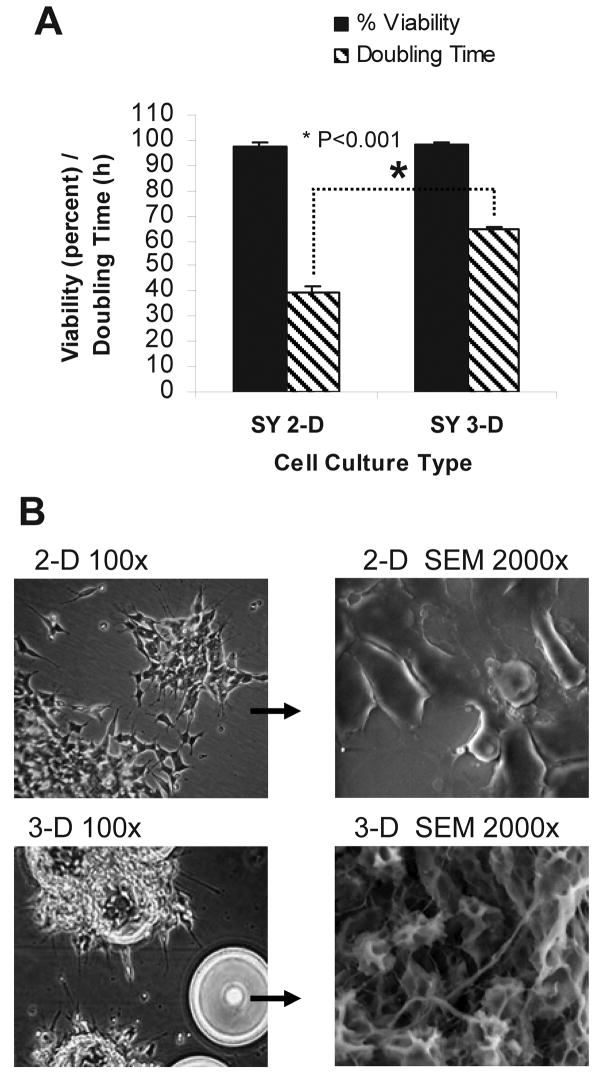
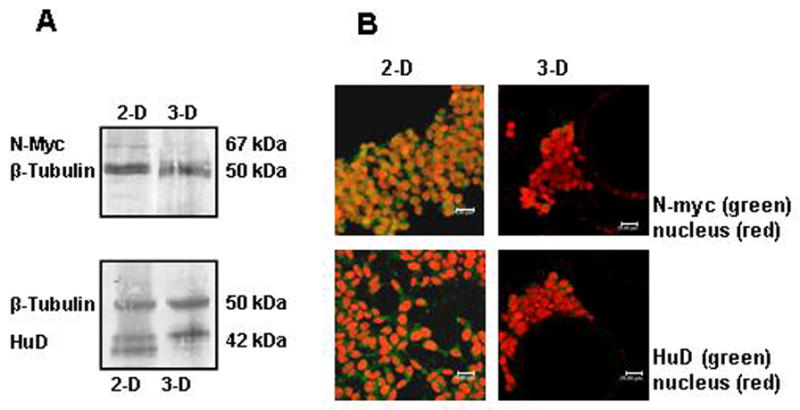
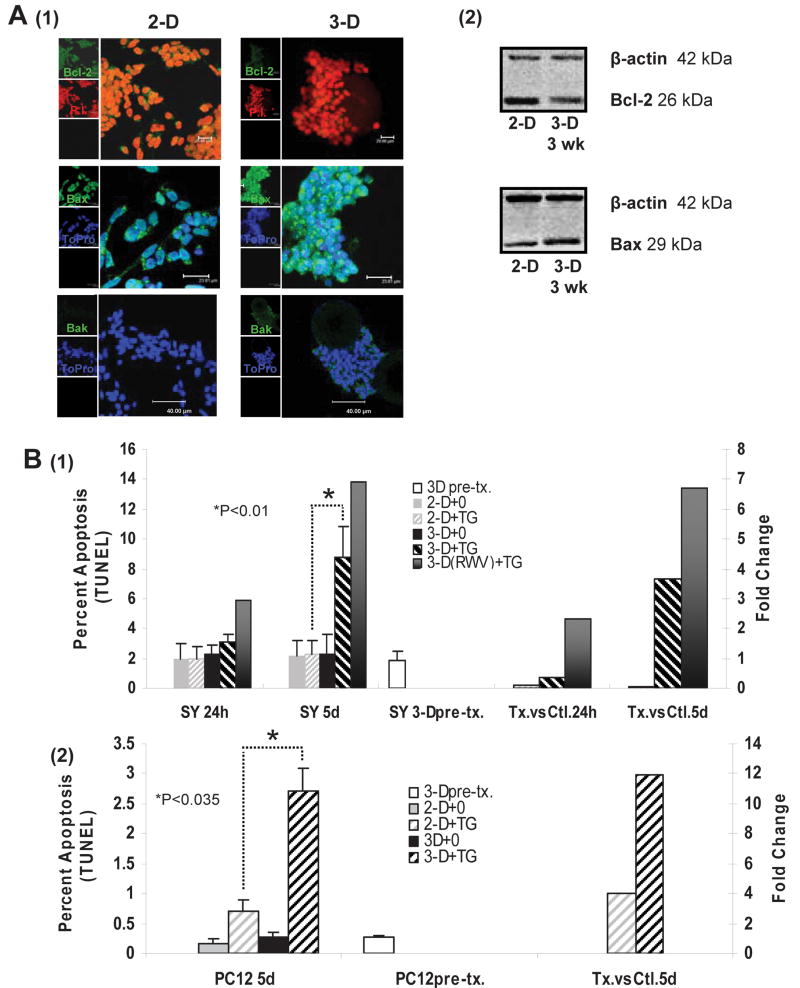
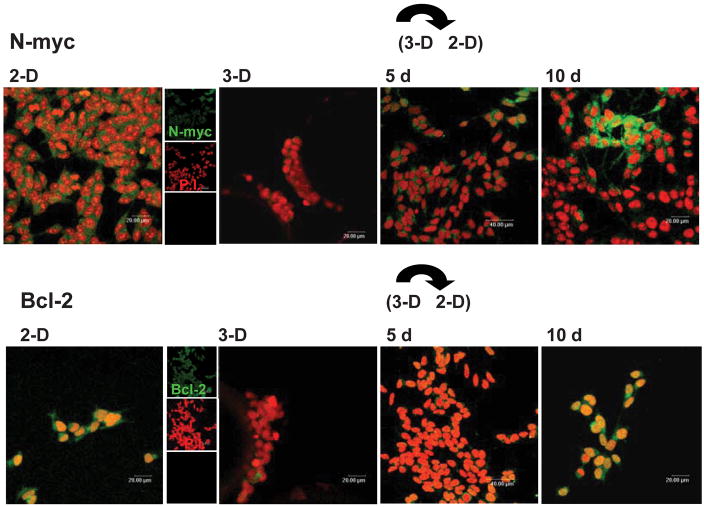
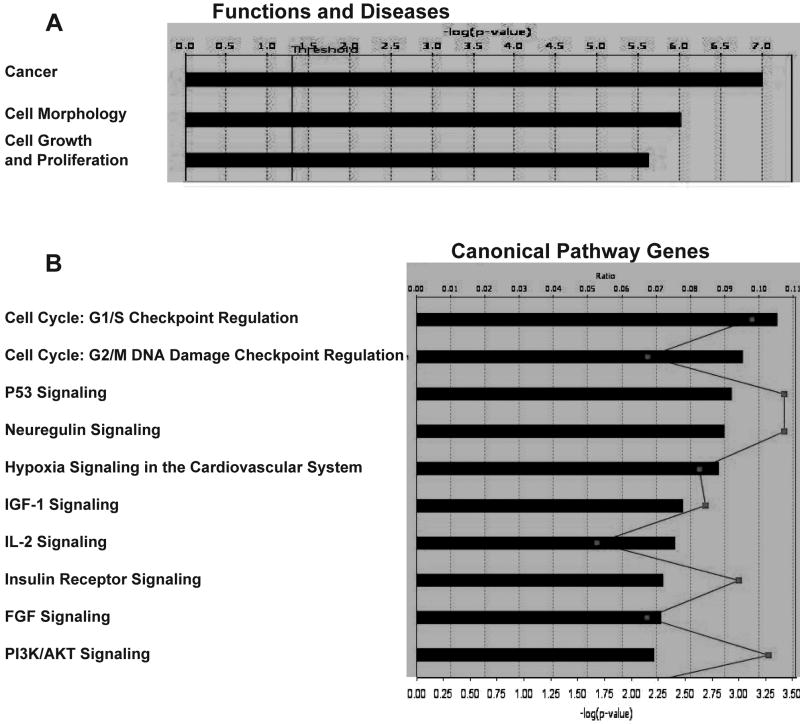
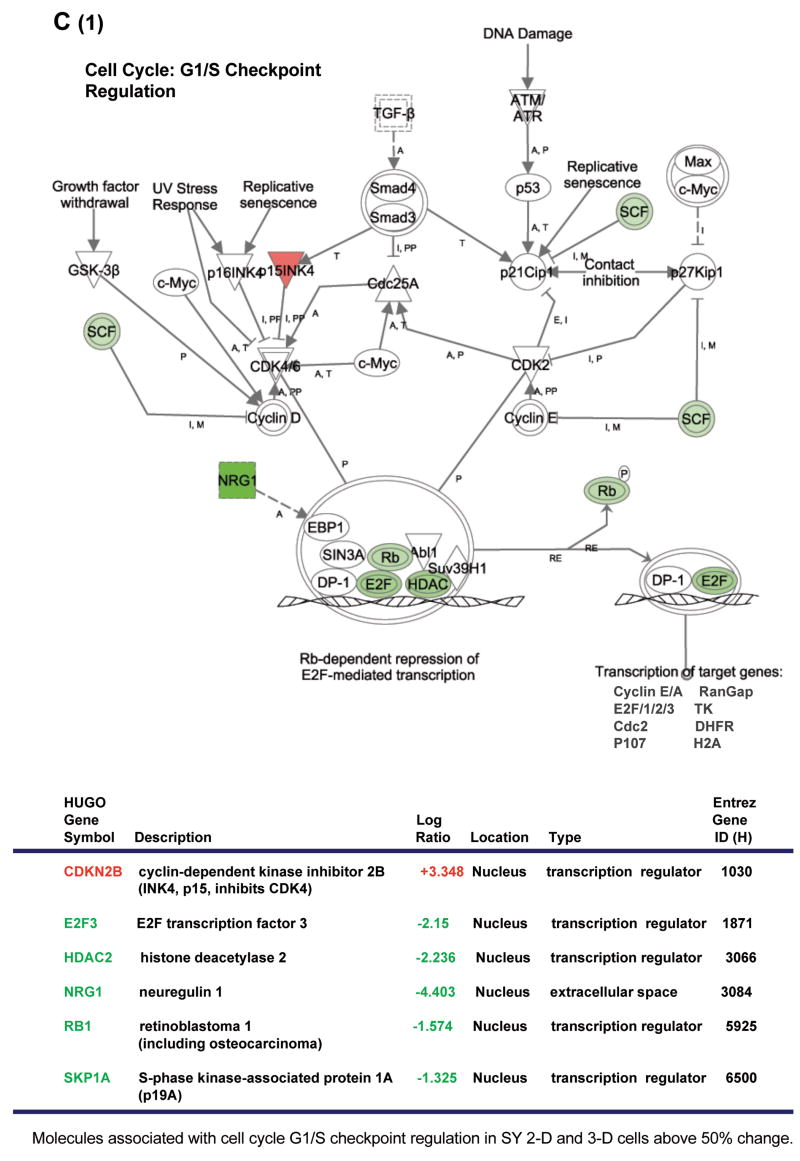
Studies of neuronal dysfunction in the central nervous system (CNS) are frequently limited by the failure of primary neurons to propagate in vitro. Neuronal cell lines can be substituted for primary cells but they often misrepresent normal conditions. We hypothesized that a three-dimensional (3D) cell culture system would drive the phenotype of transformed neurons closer to that of untransformed cells, as has been demonstrated in non-neuronal cell lines. In our studies comparing 3D versus two-dimensional (2D) culture, neuronal SH-SY5Y (SY) cells underwent distinct morphological changes combined with a significant drop in their rate of cell division. Expression of the proto-oncogene N-myc and the RNA-binding protein HuD was decreased in 3D culture as compared to standard 2D conditions. We observed a decline in the anti-apoptotic protein Bcl-2 in 3D culture, coupled with increased expression of the pro-apoptotic proteins Bax and Bak. Moreover, thapsigargin (TG)-induced apoptosis was enhanced in the 3D cells. Microarray analysis demonstrated significantly differing mRNA levels for over 700 genes in the cells of the two culture types, and indicated that alterations in the G1/S cell-cycle progression contributed to the diminished doubling rate in the 3D-cultured SY cells. These results demonstrate that a 3D culture approach narrows the phenotypic gap between neuronal cell lines and primary neurons. The resulting cells may readily be used for in vitro research of neuronal pathogenesis.
Figures
Similar articles
-
The RNA binding protein HuD: rat cDNA and analysis of the alternative spliced mRNA in neuronal differentiating cell lines P19 and PC12.Brain Res Mol Brain Res. 1996 Jan;35(1-2):285-96. doi: 10.1016/0169-328x(95)00231-g. Brain Res Mol Brain Res. 1996. PMID: 8717365
-
Cytoplasmic localization is required for the mammalian ELAV-like protein HuD to induce neuronal differentiation.Genes Cells. 1999 Nov;4(11):667-83. doi: 10.1046/j.1365-2443.1999.00292.x. Genes Cells. 1999. PMID: 10620013
-
HuD, a neuronal-specific RNA-binding protein, is a potential regulator of MYCN expression in human neuroblastoma cells.Eur J Cancer. 1997 Oct;33(12):2071-4. doi: 10.1016/s0959-8049(97)00331-6. Eur J Cancer. 1997. PMID: 9516855
-
Emerging complexity of the HuD/ELAVl4 gene; implications for neuronal development, function, and dysfunction.RNA. 2013 Aug;19(8):1019-37. doi: 10.1261/rna.039164.113. RNA. 2013. PMID: 23861535 Free PMC article. Review.
-
Role of HuD in nervous system function and pathology.Front Biosci (Schol Ed). 2013 Jan 1;5(2):554-63. doi: 10.2741/s389. Front Biosci (Schol Ed). 2013. PMID: 23277068 Review.
Cited by
-
3D Oral and Cervical Tissue Models for Studying Papillomavirus Host-Pathogen Interactions.Curr Protoc Microbiol. 2020 Dec;59(1):e129. doi: 10.1002/cpmc.129. Curr Protoc Microbiol. 2020. PMID: 33232584 Free PMC article.
-
Ethyl acetate extract of germinated brown rice attenuates hydrogen peroxide-induced oxidative stress in human SH-SY5Y neuroblastoma cells: role of anti-apoptotic, pro-survival and antioxidant genes.BMC Complement Altern Med. 2013 Jul 17;13:177. doi: 10.1186/1472-6882-13-177. BMC Complement Altern Med. 2013. PMID: 23866310 Free PMC article.
-
PEP-1-frataxin significantly increases cell proliferation and neuroblast differentiation by reducing lipid peroxidation in the mouse dentate gyrus.Neurochem Res. 2011 Dec;36(12):2452-8. doi: 10.1007/s11064-011-0574-3. Epub 2011 Sep 1. Neurochem Res. 2011. PMID: 21882036
-
A new advanced cellular model of functional cholinergic-like neurons developed by reprogramming the human SH-SY5Y neuroblastoma cell line.Cell Death Discov. 2024 Jan 12;10(1):24. doi: 10.1038/s41420-023-01790-7. Cell Death Discov. 2024. PMID: 38216593 Free PMC article.
-
Rotating cell culture systems for human cell culture: human trophoblast cells as a model.J Vis Exp. 2012 Jan 18;(59):3367. doi: 10.3791/3367. J Vis Exp. 2012. PMID: 22297395 Free PMC article.
References
-
- Abbott A. Cell culture: biology’s new dimension. Nature. 2003;424:870–2. - PubMed
-
- Anderson KD, Morin MA, Beckel-Mitchener A, Mobarak CD, Neve RL, Furneaux HM, Burry R, Perrone-Bizzozero NI. Overexpression of HuD, but not of its truncated form HuD I+II, promotes GAP-43 gene expression and neurite outgrowth in PC12 cells in the absence of nerve growth factor. Journal of neurochemistry. 2000;75:1103–14. - PubMed
-
- Attiah DG, Kopher RA, Desai TA. Characterization of PC12 cell proliferation and differentiation-stimulated by ECM adhesion proteins and neurotrophic factors. Journal of materials science. 2003;14:1005–9. - PubMed
-
- Becker EB, Bonni A. Cell cycle regulation of neuronal apoptosis in development and disease. Progress in neurobiology. 2004;72:1–25. - PubMed
Publication types
MeSH terms
Substances
Grants and funding
LinkOut - more resources
Full Text Sources
Research Materials
Miscellaneous
